Edge16 Oct 2026
Winner, Winner: The Chicken McNugget Story
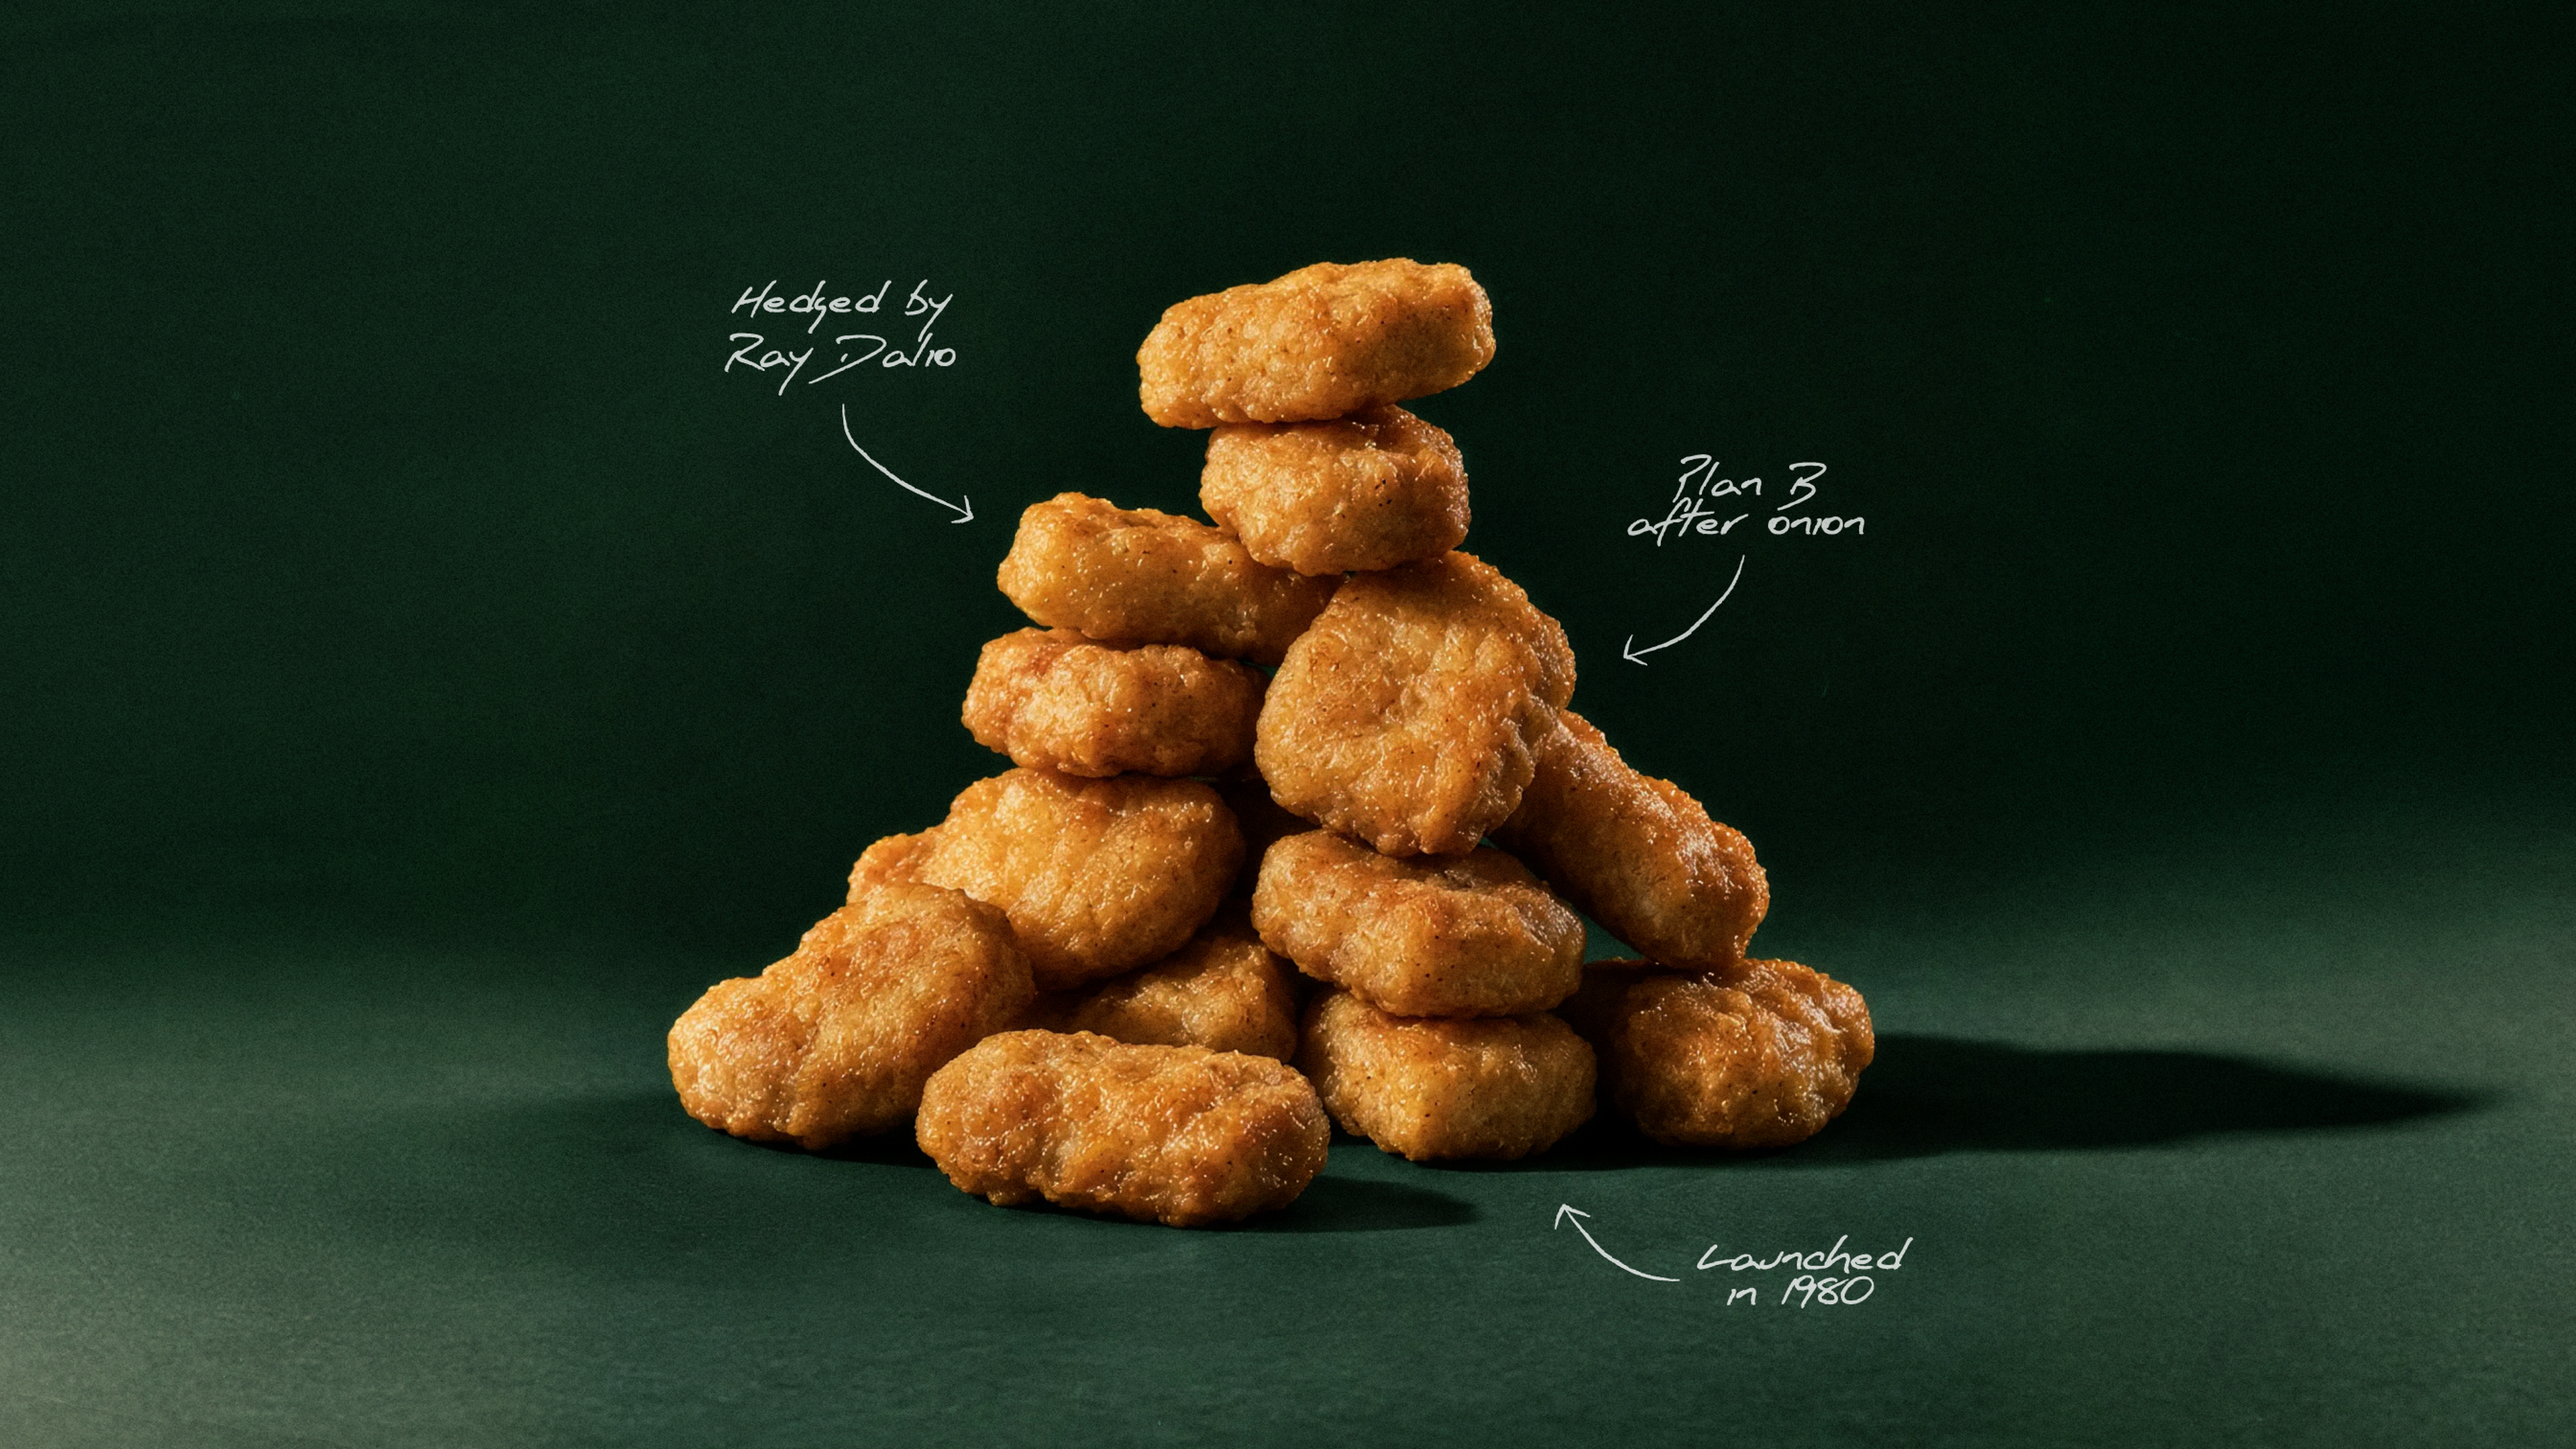
How a 1940s breeding contest, a Cornell food scientist, and a hedge by Ray Dalio helped McDonald's turn the Chicken McNugget into a fast-food icon.

Axiom spin-off is on track for calendar Q1 2027, creating two focused public businesses: a scaled contract manufacturer and an AI-native industrial business focused on power products and innovation.
Post-spin manufacturing operations start from FY26 net sales of $21B, 110,000 employees, operations in 30 countries and 55+ years of advanced manufacturing experience.
Axiom will own system IP for power products and retain embedded power, critical power and compute; manufacturing expertise remains available to industrialize, test and scale systems, while networking stays with the manufacturing business.
FY19-FY26 portfolio shift included the Nextracker spin-off and building critical digital infrastructure across power, compute and cooling; FY26 adjusted operating margin reached 6%, nearly double FY19.
Six high-value markets—medical devices, drug delivery, energy infrastructure, robotics, advanced networking and satellite communications—offer double-digit growth and margins above the portfolio average.
High-value markets were 24% of FY26 revenue, expected to approach 30% in FY27 and reach 35%-40% in FY29; FY27 growth is expected to be ~2x.
RMS healthcare design participation earns an average 250 bps margin premium over base EMS programs, supported by 12 FDA-registered sites and 20+ ISO 13485-certified sites.
RMS industrial revenue grew double digits in FY26; energy infrastructure and robotics were each on track to double revenue in FY27, following a 230 bps operating-profit improvement from FY25 to FY26.
Advanced networking is the largest ITS growth opportunity, with a second consecutive year of double-digit growth expected in FY27; satellite communications is also expected to grow double digits, supported by 6+ years of investment.
FY27 outlook: RMS revenue growth mid- to high-single digits, ITS low-double digits to low teens, and total growth high-single digits to low-double digits; adjusted operating margin 5.9%-6.1%, or 5.7%-5.9% pro forma post-spin.
FY29 direction calls for mid-single-digit organic revenue growth and high-value markets at 35%-40% of revenue; FY29 revenue growth is direction, not guidance.
FY29 targets include pro forma adjusted operating margin of 7%+, with >100 bps expansion from FY27 direction and over $200M of incremental adjusted operating income; mix, productivity and fixed-cost leverage drive expansion.
Through FY29, annual adjusted EPS growth target is double digits, supported by mid-single-digit revenue growth, >100 bps margin expansion and ~$100M annual interest savings from debt reduction through the Axiom stake exchange.
Free cash flow conversion target is 80%+ of adjusted net income, with capex at ~2% of revenue; FY28 direction also calls for continued growth and margin expansion.

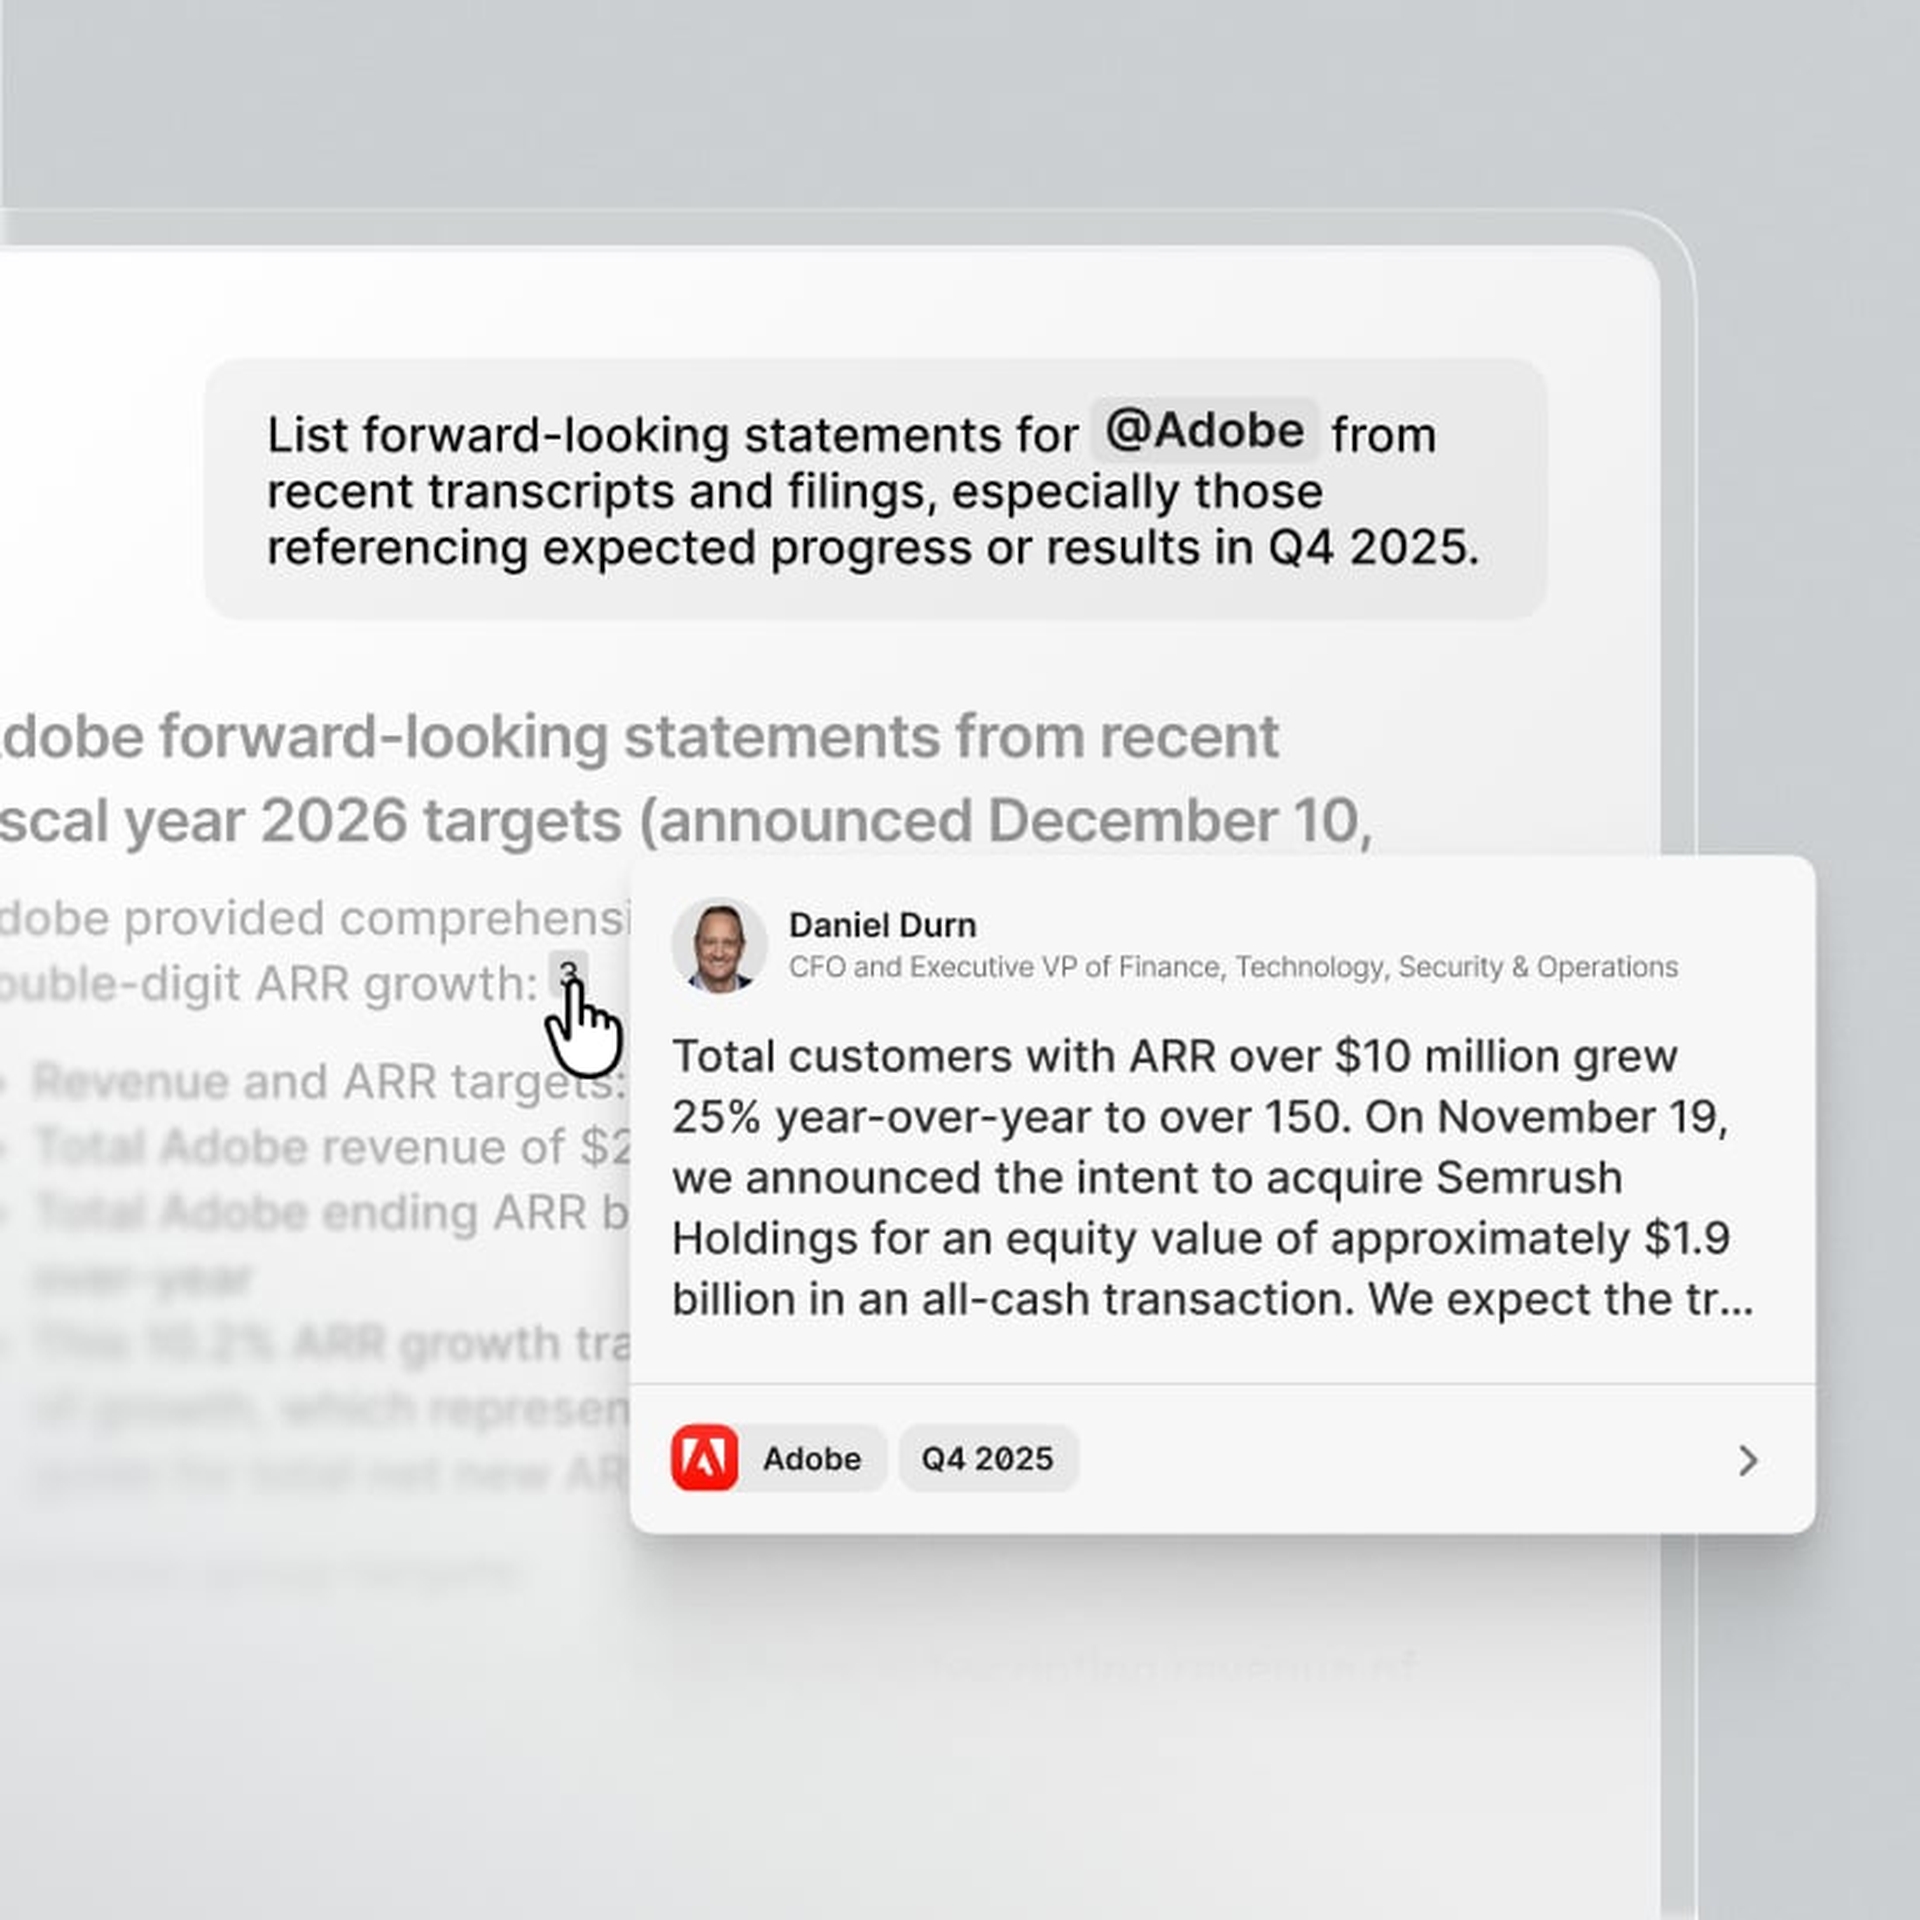
AI chat
Automations


Live audio & transcripts

Quartr's AI stands out because it only pulls clean, first-party data from public companies. In investing, that's everything.
Jamie Ross
Investment Manager, GAM Investments
Research that used to take hours now takes seconds with Quartr Pro. Tracking shifts in tone or extracting tables, it's as simple as typing a query.
Tom O'Hara
Investment Director
Before Quartr we spent hours manually compiling insights through the peer earnings cycle. Now, these tasks are done faster, with greater precision.
Gregg Lampf
VP of Investor Relations
Being able to ask specific questions across years of transcripts and reports and instantly get verified answers is a game-changer.
Pontus Dackmo
CEO & Investment Manager