Edge16 Oct 2026
Winner, Winner: The Chicken McNugget Story
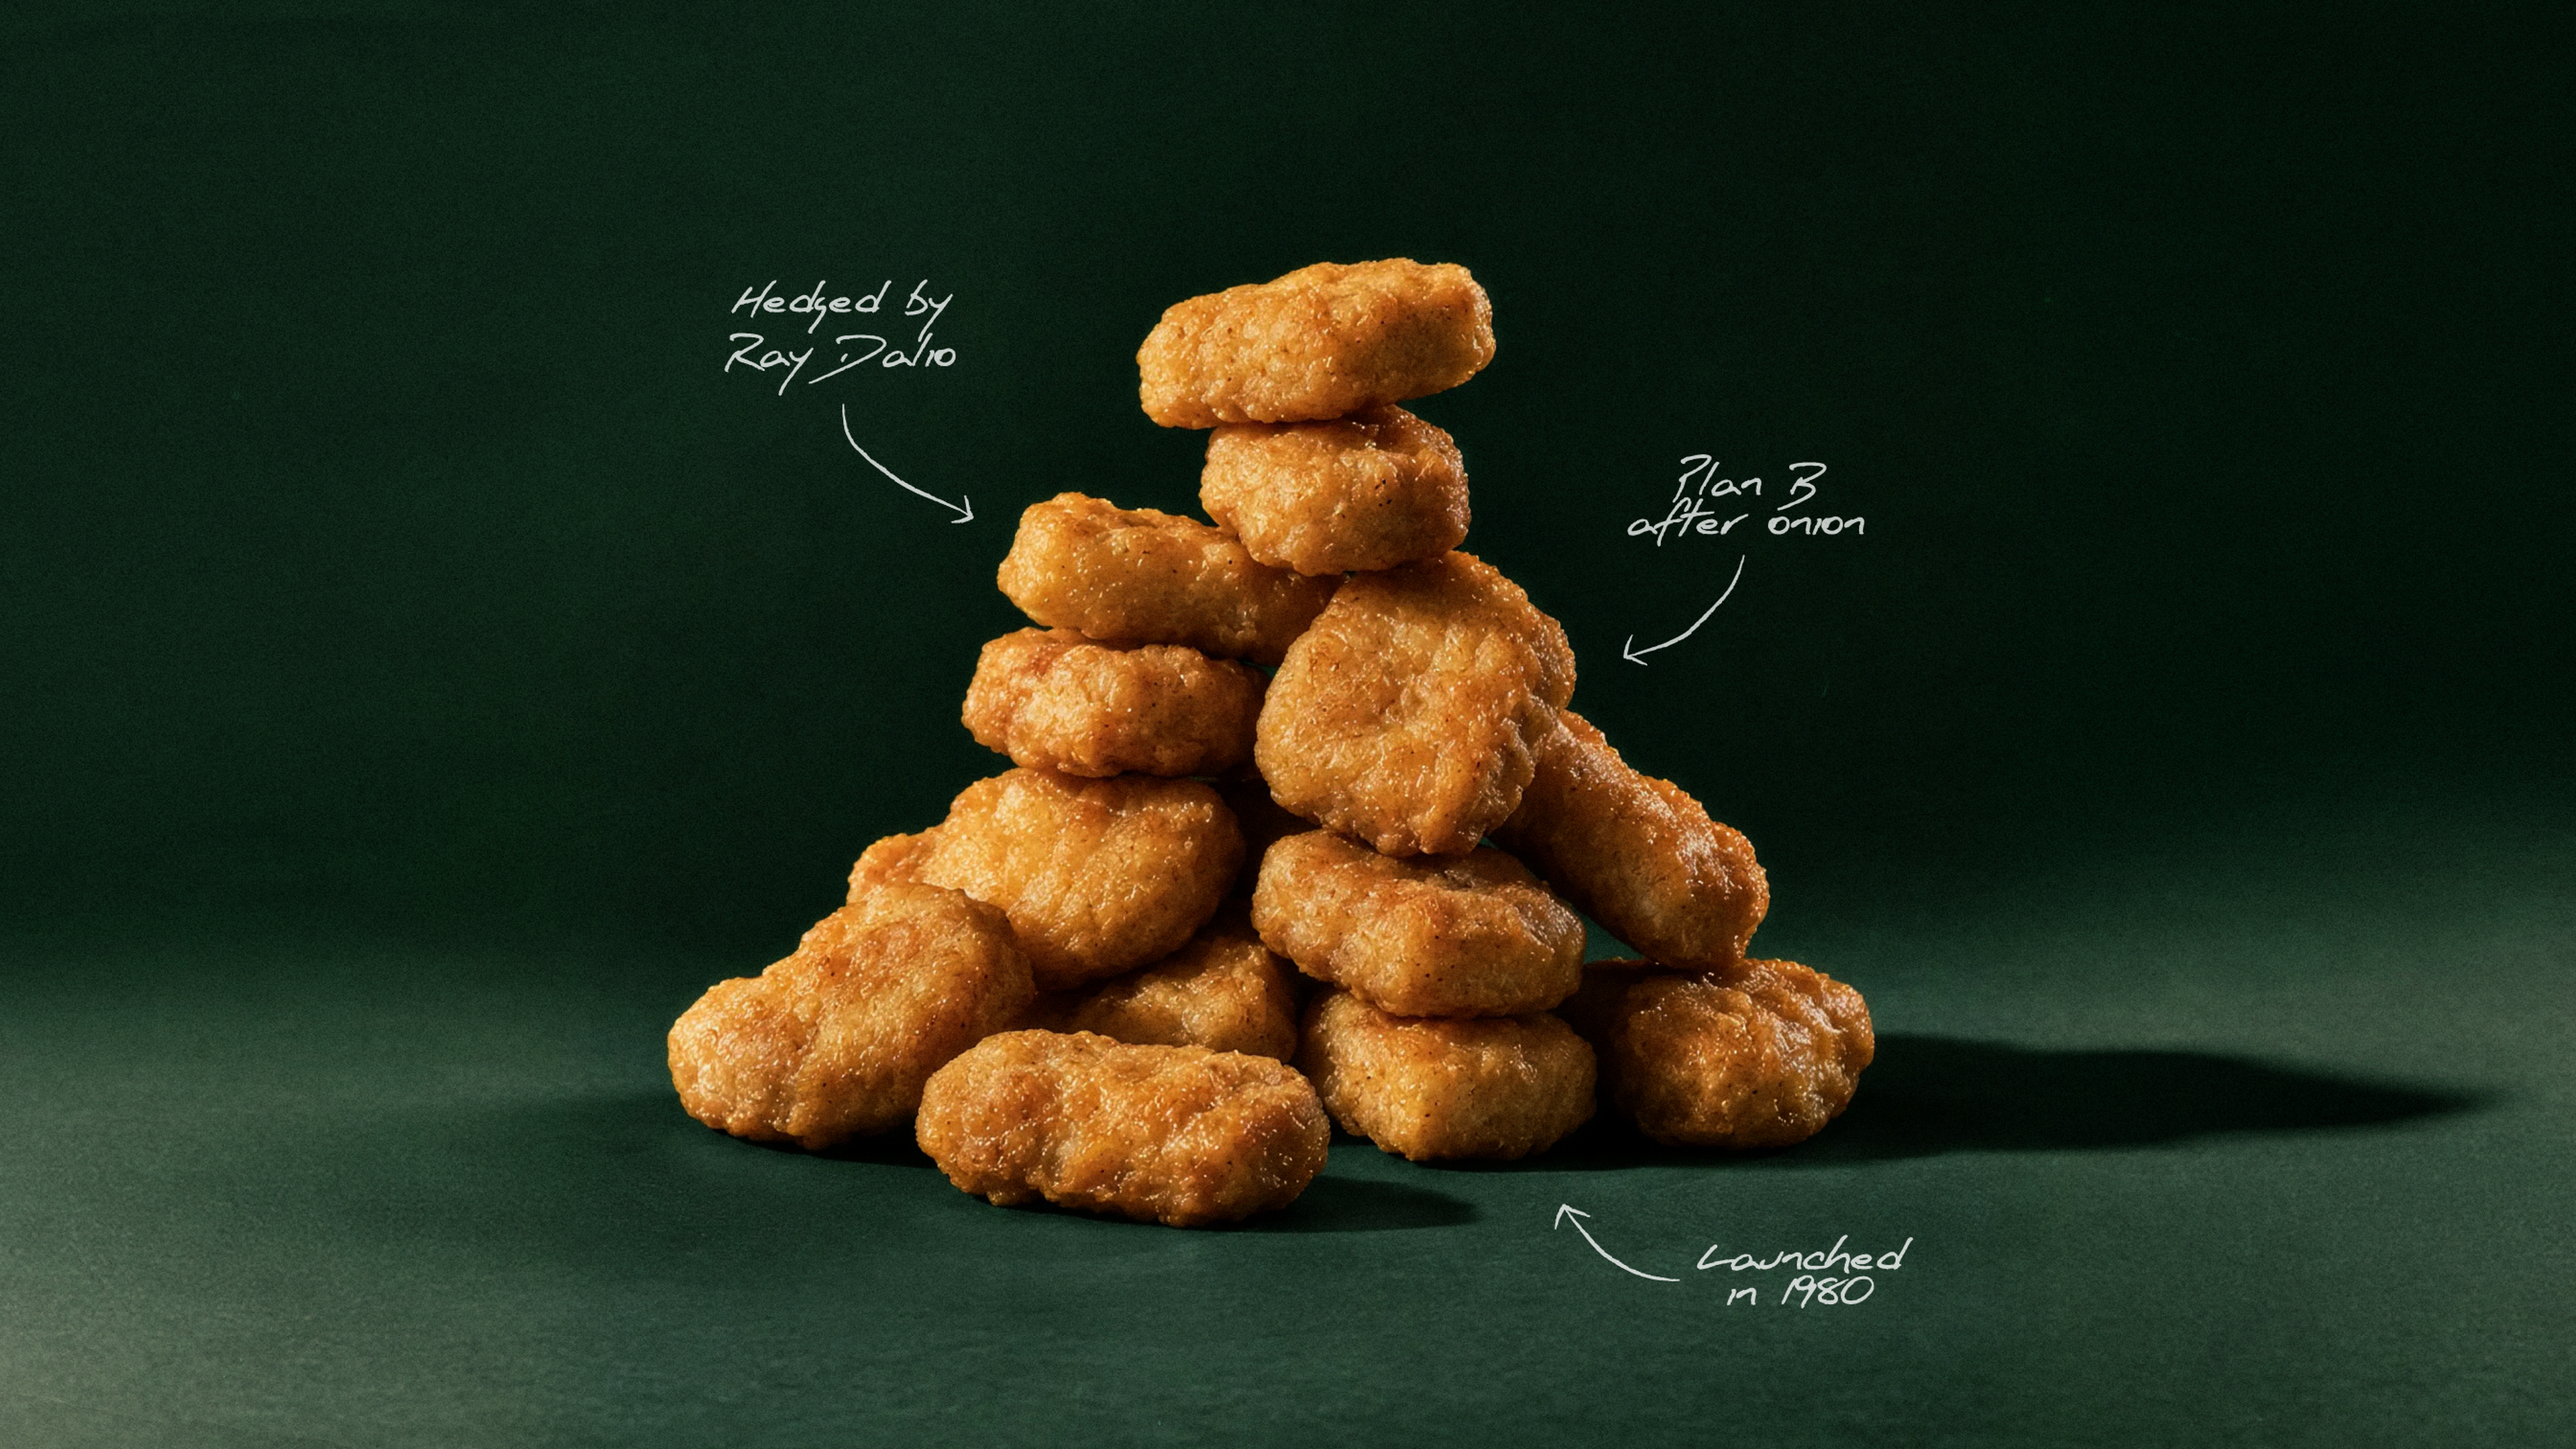
How a 1940s breeding contest, a Cornell food scientist, and a hedge by Ray Dalio helped McDonald's turn the Chicken McNugget into a fast-food icon.

Q3 net income was $12 million; income attributable to common stockholders was $3 million, or $0.01 per diluted share. Core trends improved QoQ, with NII, NIM and adjusted PPNR rising.
C&I loans grew $2.0 billion QoQ as CRE and multifamily balances declined; net charge-offs were $74 million, down $26 million QoQ.
Higher-for-longer rates, credit pressures and deposit competition shifted long-term financial objectives from 2027 to 2028 without changing strategic priorities.
Q3 revenue was $530 million, including $460 million of NII and $70 million of noninterest income; NII rose 5% QoQ and 8% YoY.
NIM increased 4 bps QoQ to 2.17%; adjusted PPNR rose 6% QoQ to $66 million, excluding the prior-quarter Figure investment impact.
Provision for credit losses was $76 million, versus $18 million in Q2; net charge-offs were $74 million, or 0.49% of average loans, down $26 million QoQ.
Operating expenses were $441 million, up 3% QoQ and down 8% YoY; FY26 expenses are expected to decline ~$165 million, or ~9%, from FY25.
Nine-month net income was $67 million versus a $206 million net loss in 9M 2025; Q3 included a $22 million benefit from settling the 2019–2021 federal tax audit.
Long-term financial objectives and peer-like profitability targets moved from 2027 to 2028, reflecting higher-for-longer rates and credit costs.
Adjusted diluted EPS guidance is $0.10–$0.15 for FY26, $0.85–$0.95 for FY27 and $1.60–$1.70 for FY28; NII guidance is $1.815B–$1.830B, $2.2B–$2.3B and $2.6B–$2.7B, respectively.
NIM guidance is 2.15%–2.20% for FY26, 2.50%–2.60% for FY27 and 2.85%–2.95% for FY28; adjusted PPNR guidance rises from $250M–$275M to $800M–$900M and $1.225B–$1.325B, respectively.
Average balance-sheet growth is forecast at ~$1 billion per quarter in 2027 and 2028, supported by ~$2 billion of quarterly net new loans; forecast deposit inflows are $800 million–$1 billion per quarter.
Q4 NIM is expected at 2.20%–2.25%; non-accrual loans are projected at ~$2.6 billion at 2026 year-end and ~$2 billion through 2027.

AI chat

Automations


Live audio & transcripts

Quartr's AI stands out because it only pulls clean, first-party data from public companies. In investing, that's everything.
Jamie Ross
Investment Manager, GAM Investments
Research that used to take hours now takes seconds with Quartr Pro. Tracking shifts in tone or extracting tables, it's as simple as typing a query.
Tom O'Hara
Investment Director
Before Quartr we spent hours manually compiling insights through the peer earnings cycle. Now, these tasks are done faster, with greater precision.
Gregg Lampf
VP of Investor Relations
Being able to ask specific questions across years of transcripts and reports and instantly get verified answers is a game-changer.
Pontus Dackmo
CEO & Investment Manager