Edge16 Oct 2026
Winner, Winner: The Chicken McNugget Story
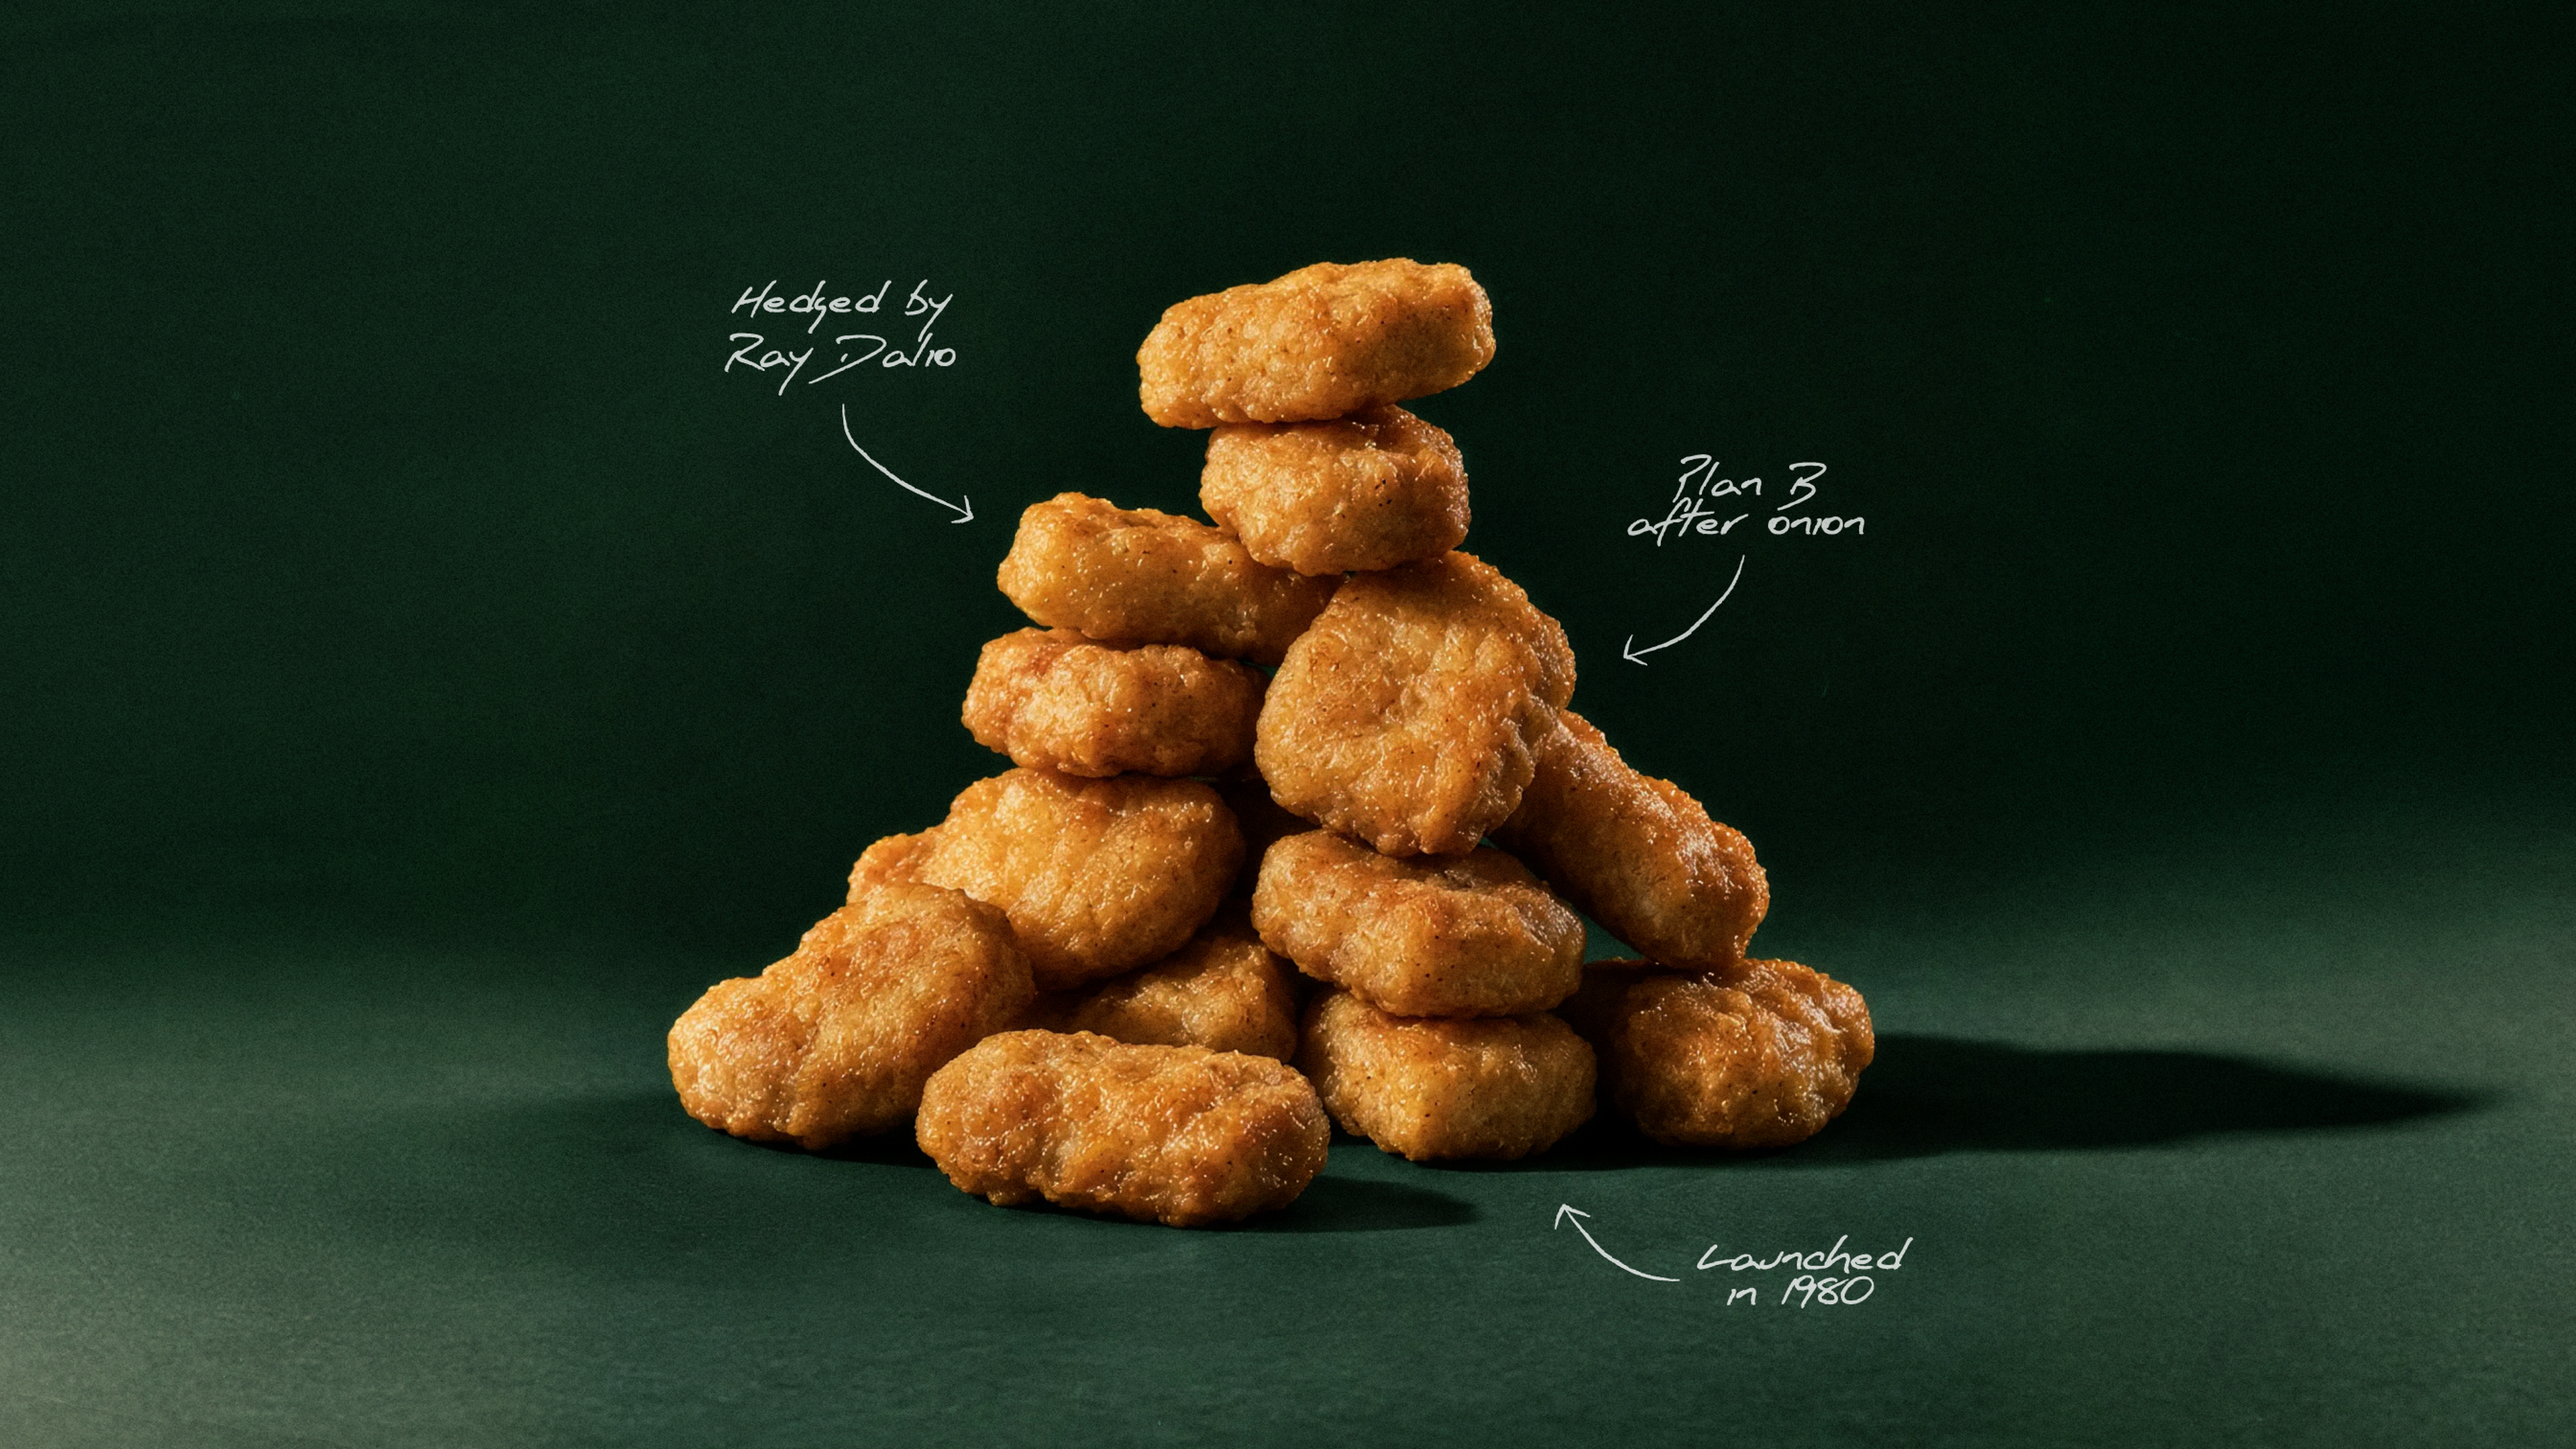
How a 1940s breeding contest, a Cornell food scientist, and a hedge by Ray Dalio helped McDonald's turn the Chicken McNugget into a fast-food icon.

161 operating properties, 25M SF owned GLA, 95.3% retail leased, $23.52 retail ABR per SF and ~3,800 operating leases.
66% of weighted ABR is in Sun Belt markets, 80% in assets with a grocery component and 23% in strategic gateway markets.
Market cap was $5.2B and enterprise value $8.3B as of Nov. 13, 2026; net debt to adjusted EBITDA was 5.2x.
The plan targets higher exposure to lifestyle and smaller grocery-anchored centers, lower watchlist exposure and portfolio improvement; total sources and uses are targeted at $1.306B.
Uses include $539M for share repurchases, $256M for 1031 acquisitions, $250M for Legacy West net equity and $40M for structured financing.
An additional $168M of sales was expected in late 2026 and early 2027; completing planned taxable-loss sales in 2026 was expected to avoid a potential $60M special dividend.
Under the assumption that remaining sales close and proceeds go to debt reduction, projected net annualized Core FFO impact is ($0.017) per share; repurchases assume a 23% discount to consensus NAV.
Current portfolio lease bumps average 188 bps versus 154 bps for assets sold since 2024; current retail ABR is $23.52 per SF versus $19.45 for sold assets.
Watchlist tenancy reduced by over 1M SF across 61 locations, cutting watchlist exposure by nearly 240 bps; five watchlist tenants left the top-25 list since 4Q24.
Since 4Q23, 69 anchor boxes were re-leased at a 42.3% comparable cash rent spread, from $13.42 to $19.10 per SF; new anchor bumps averaged 1.72% versus 1.13% portfolio-wide.
Lifestyle/mixed-use centers rose to 28% of weighted ABR in Q3'26 from 22% in Q4'22; neighborhood/local centers rose to 39% from 36%.

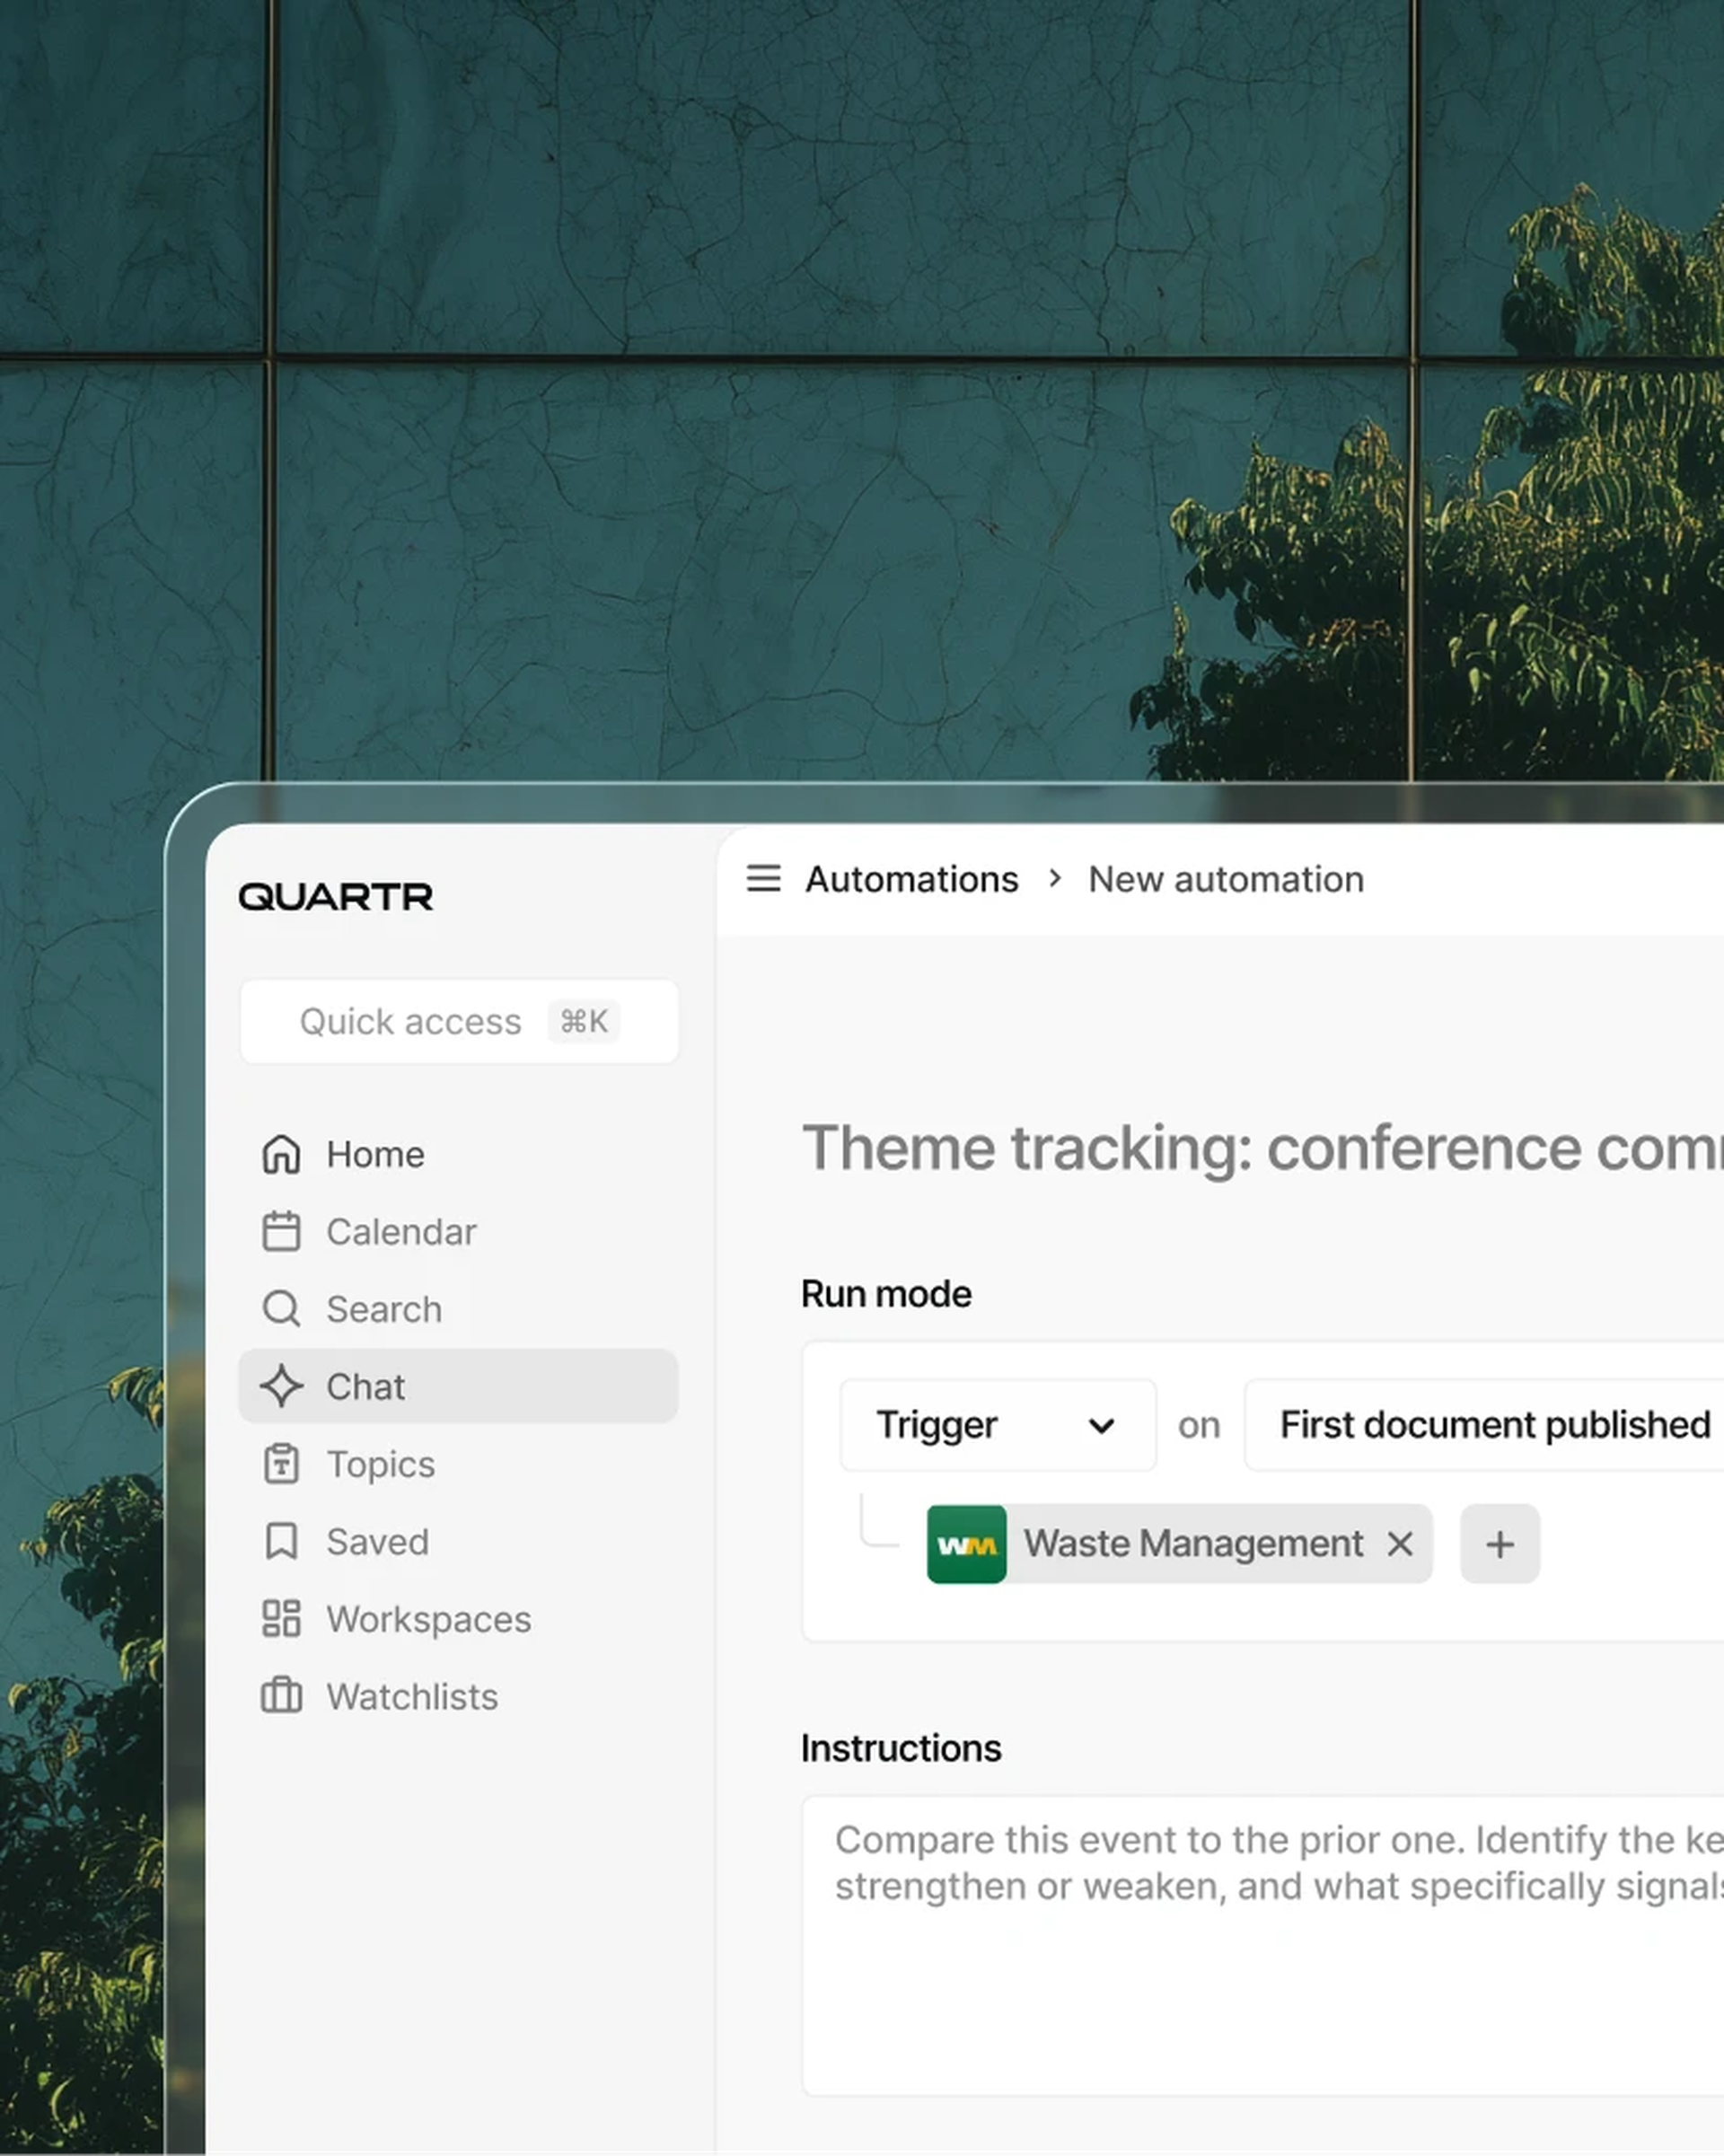
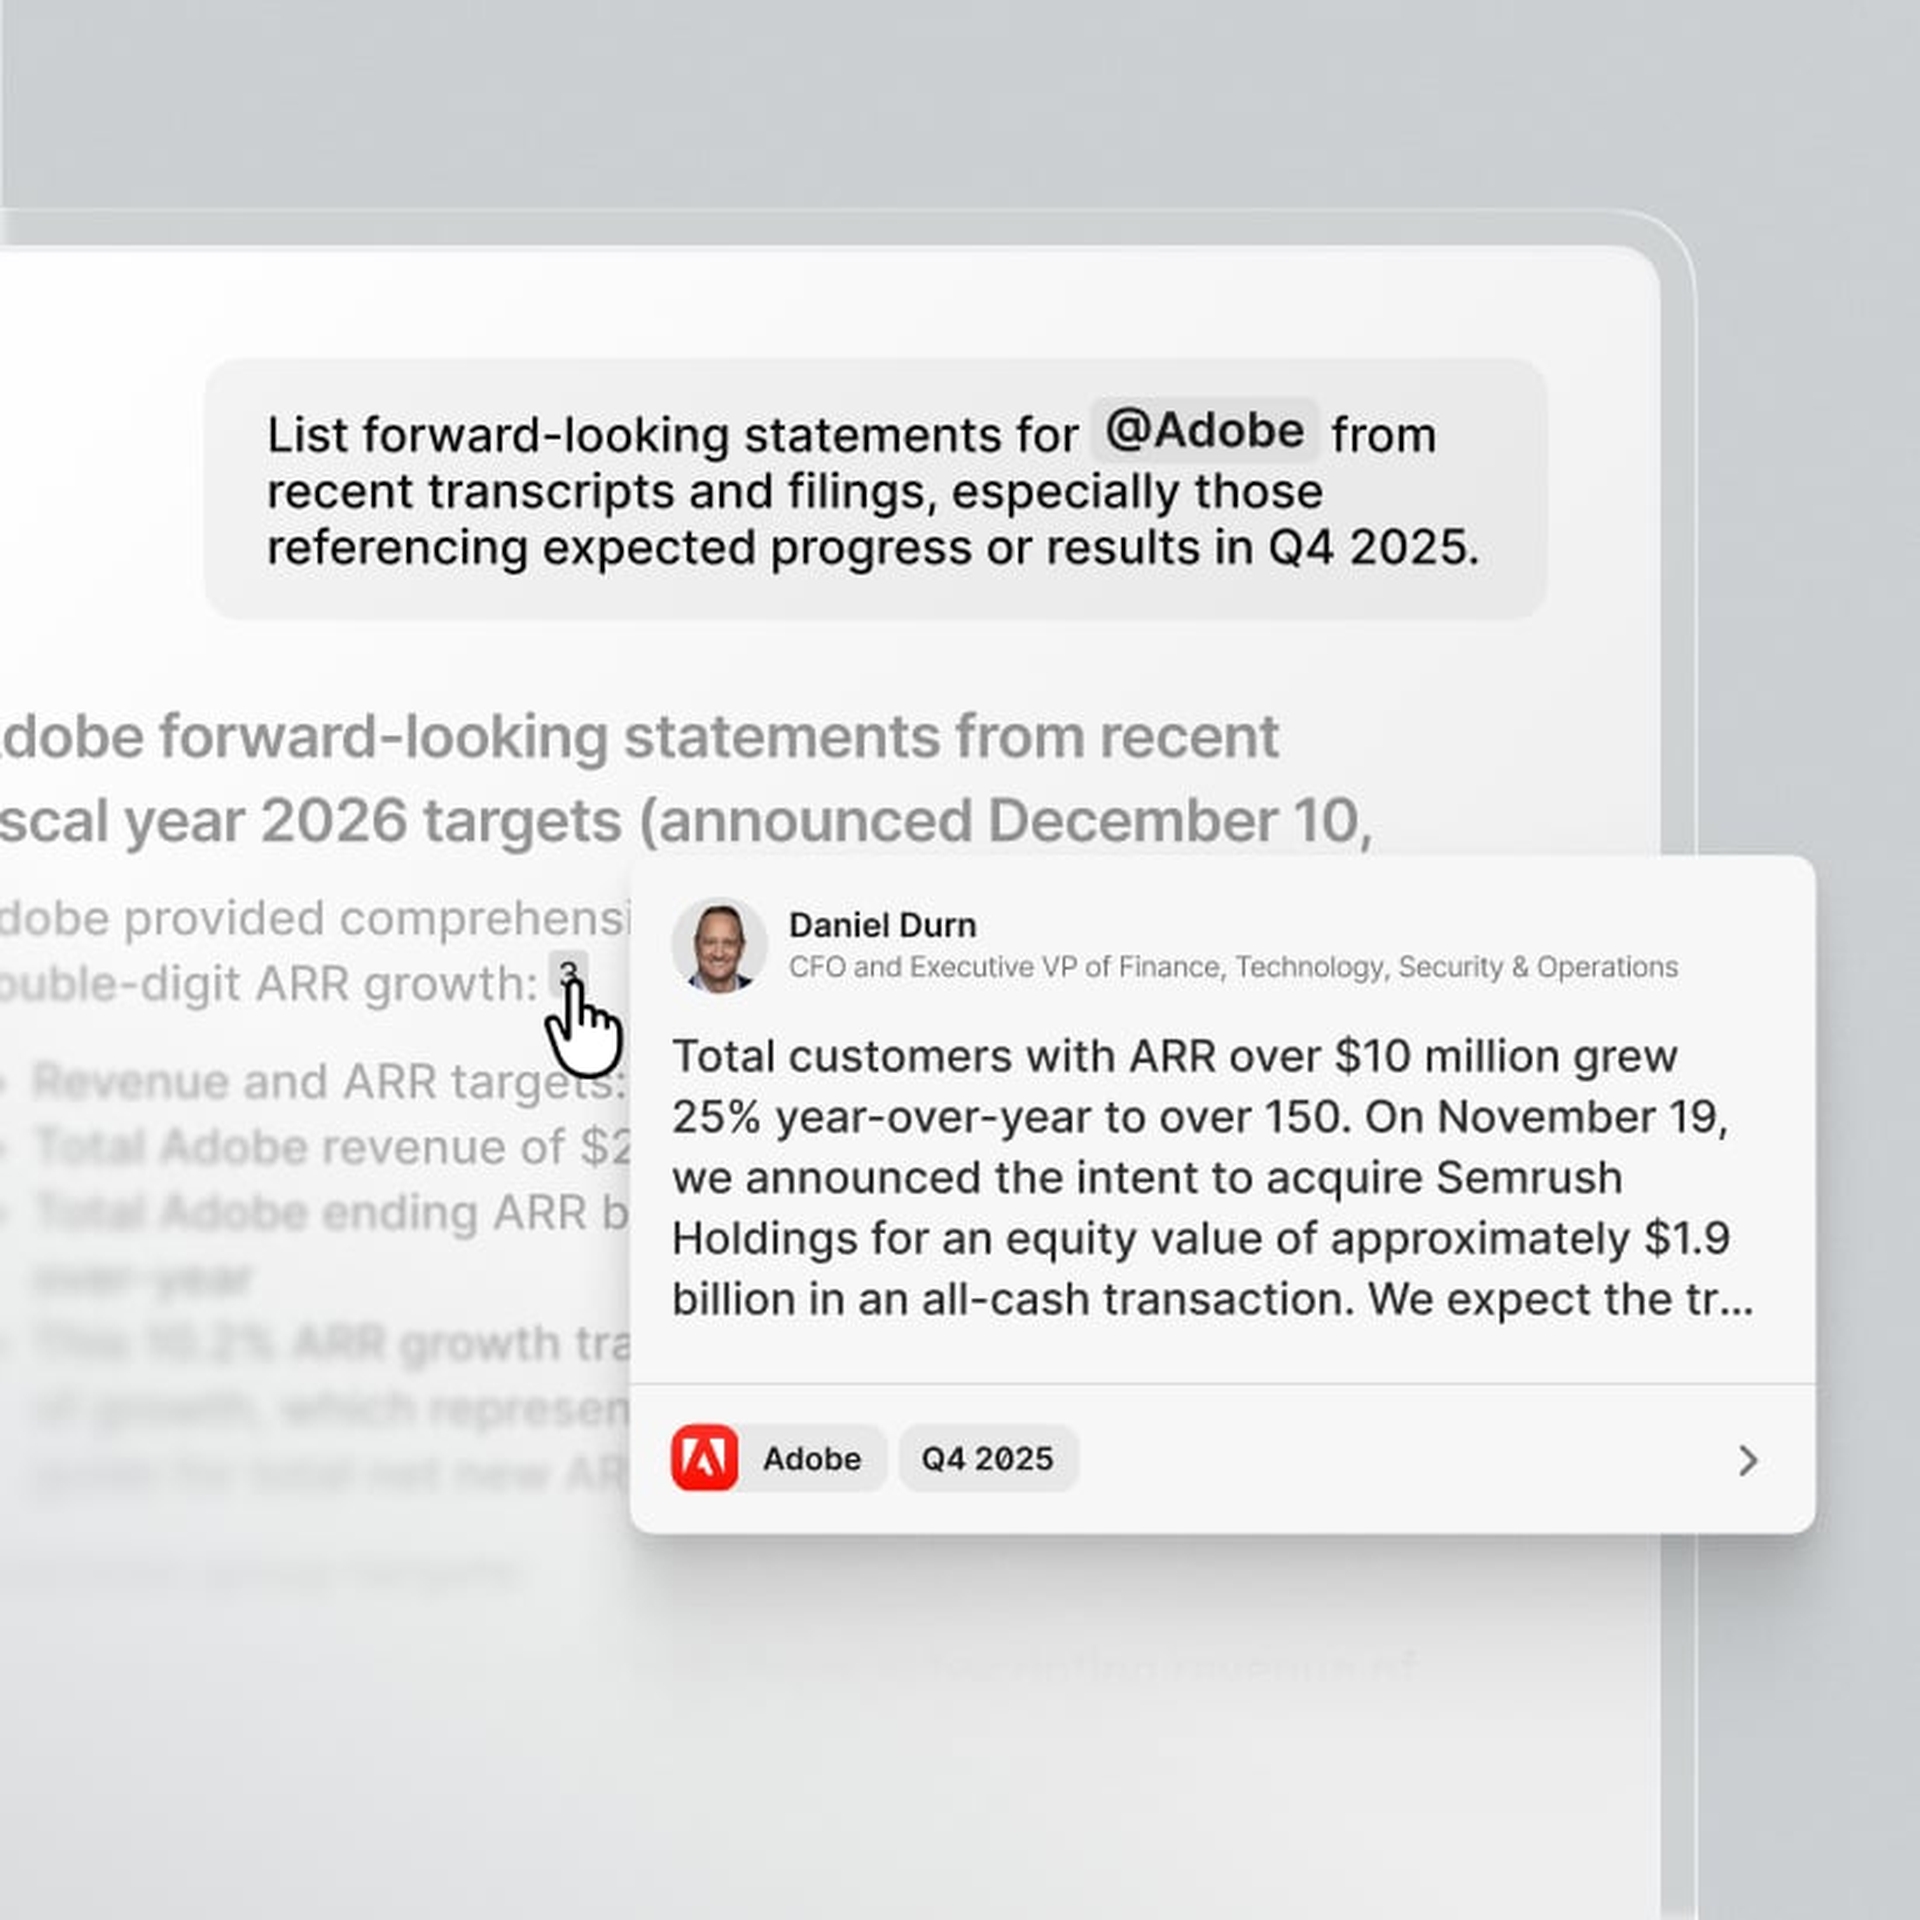
AI chat
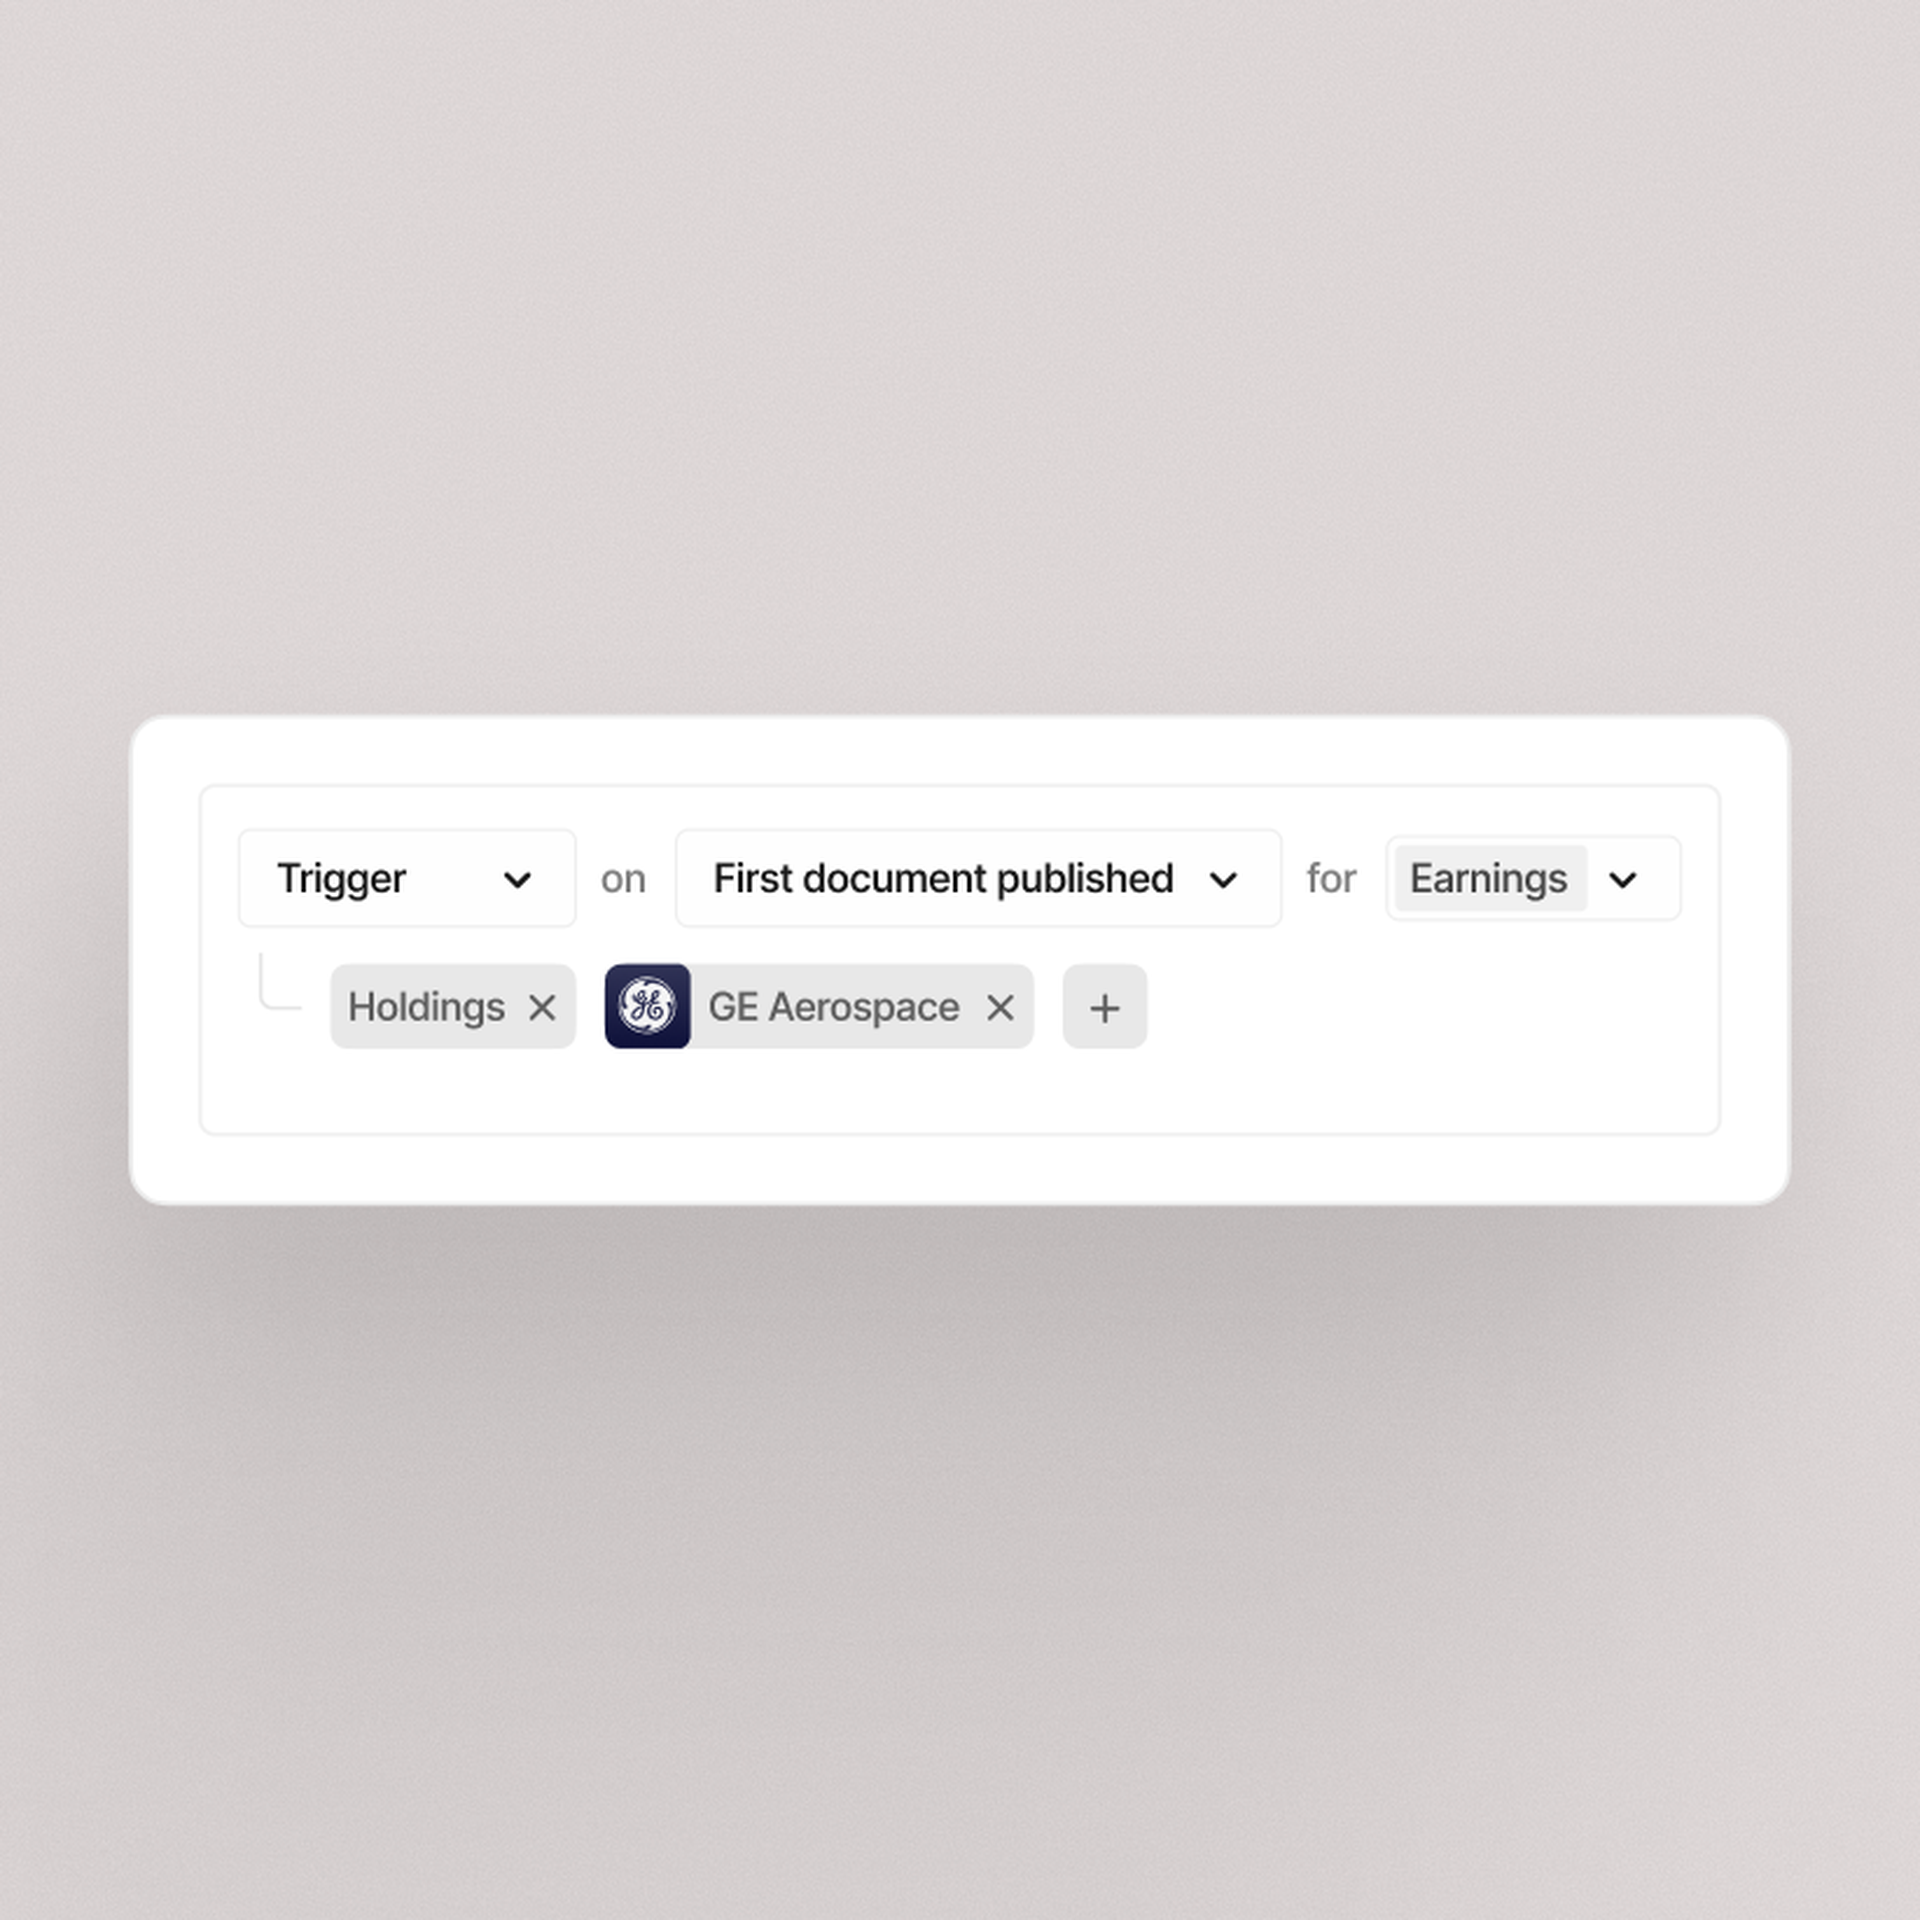
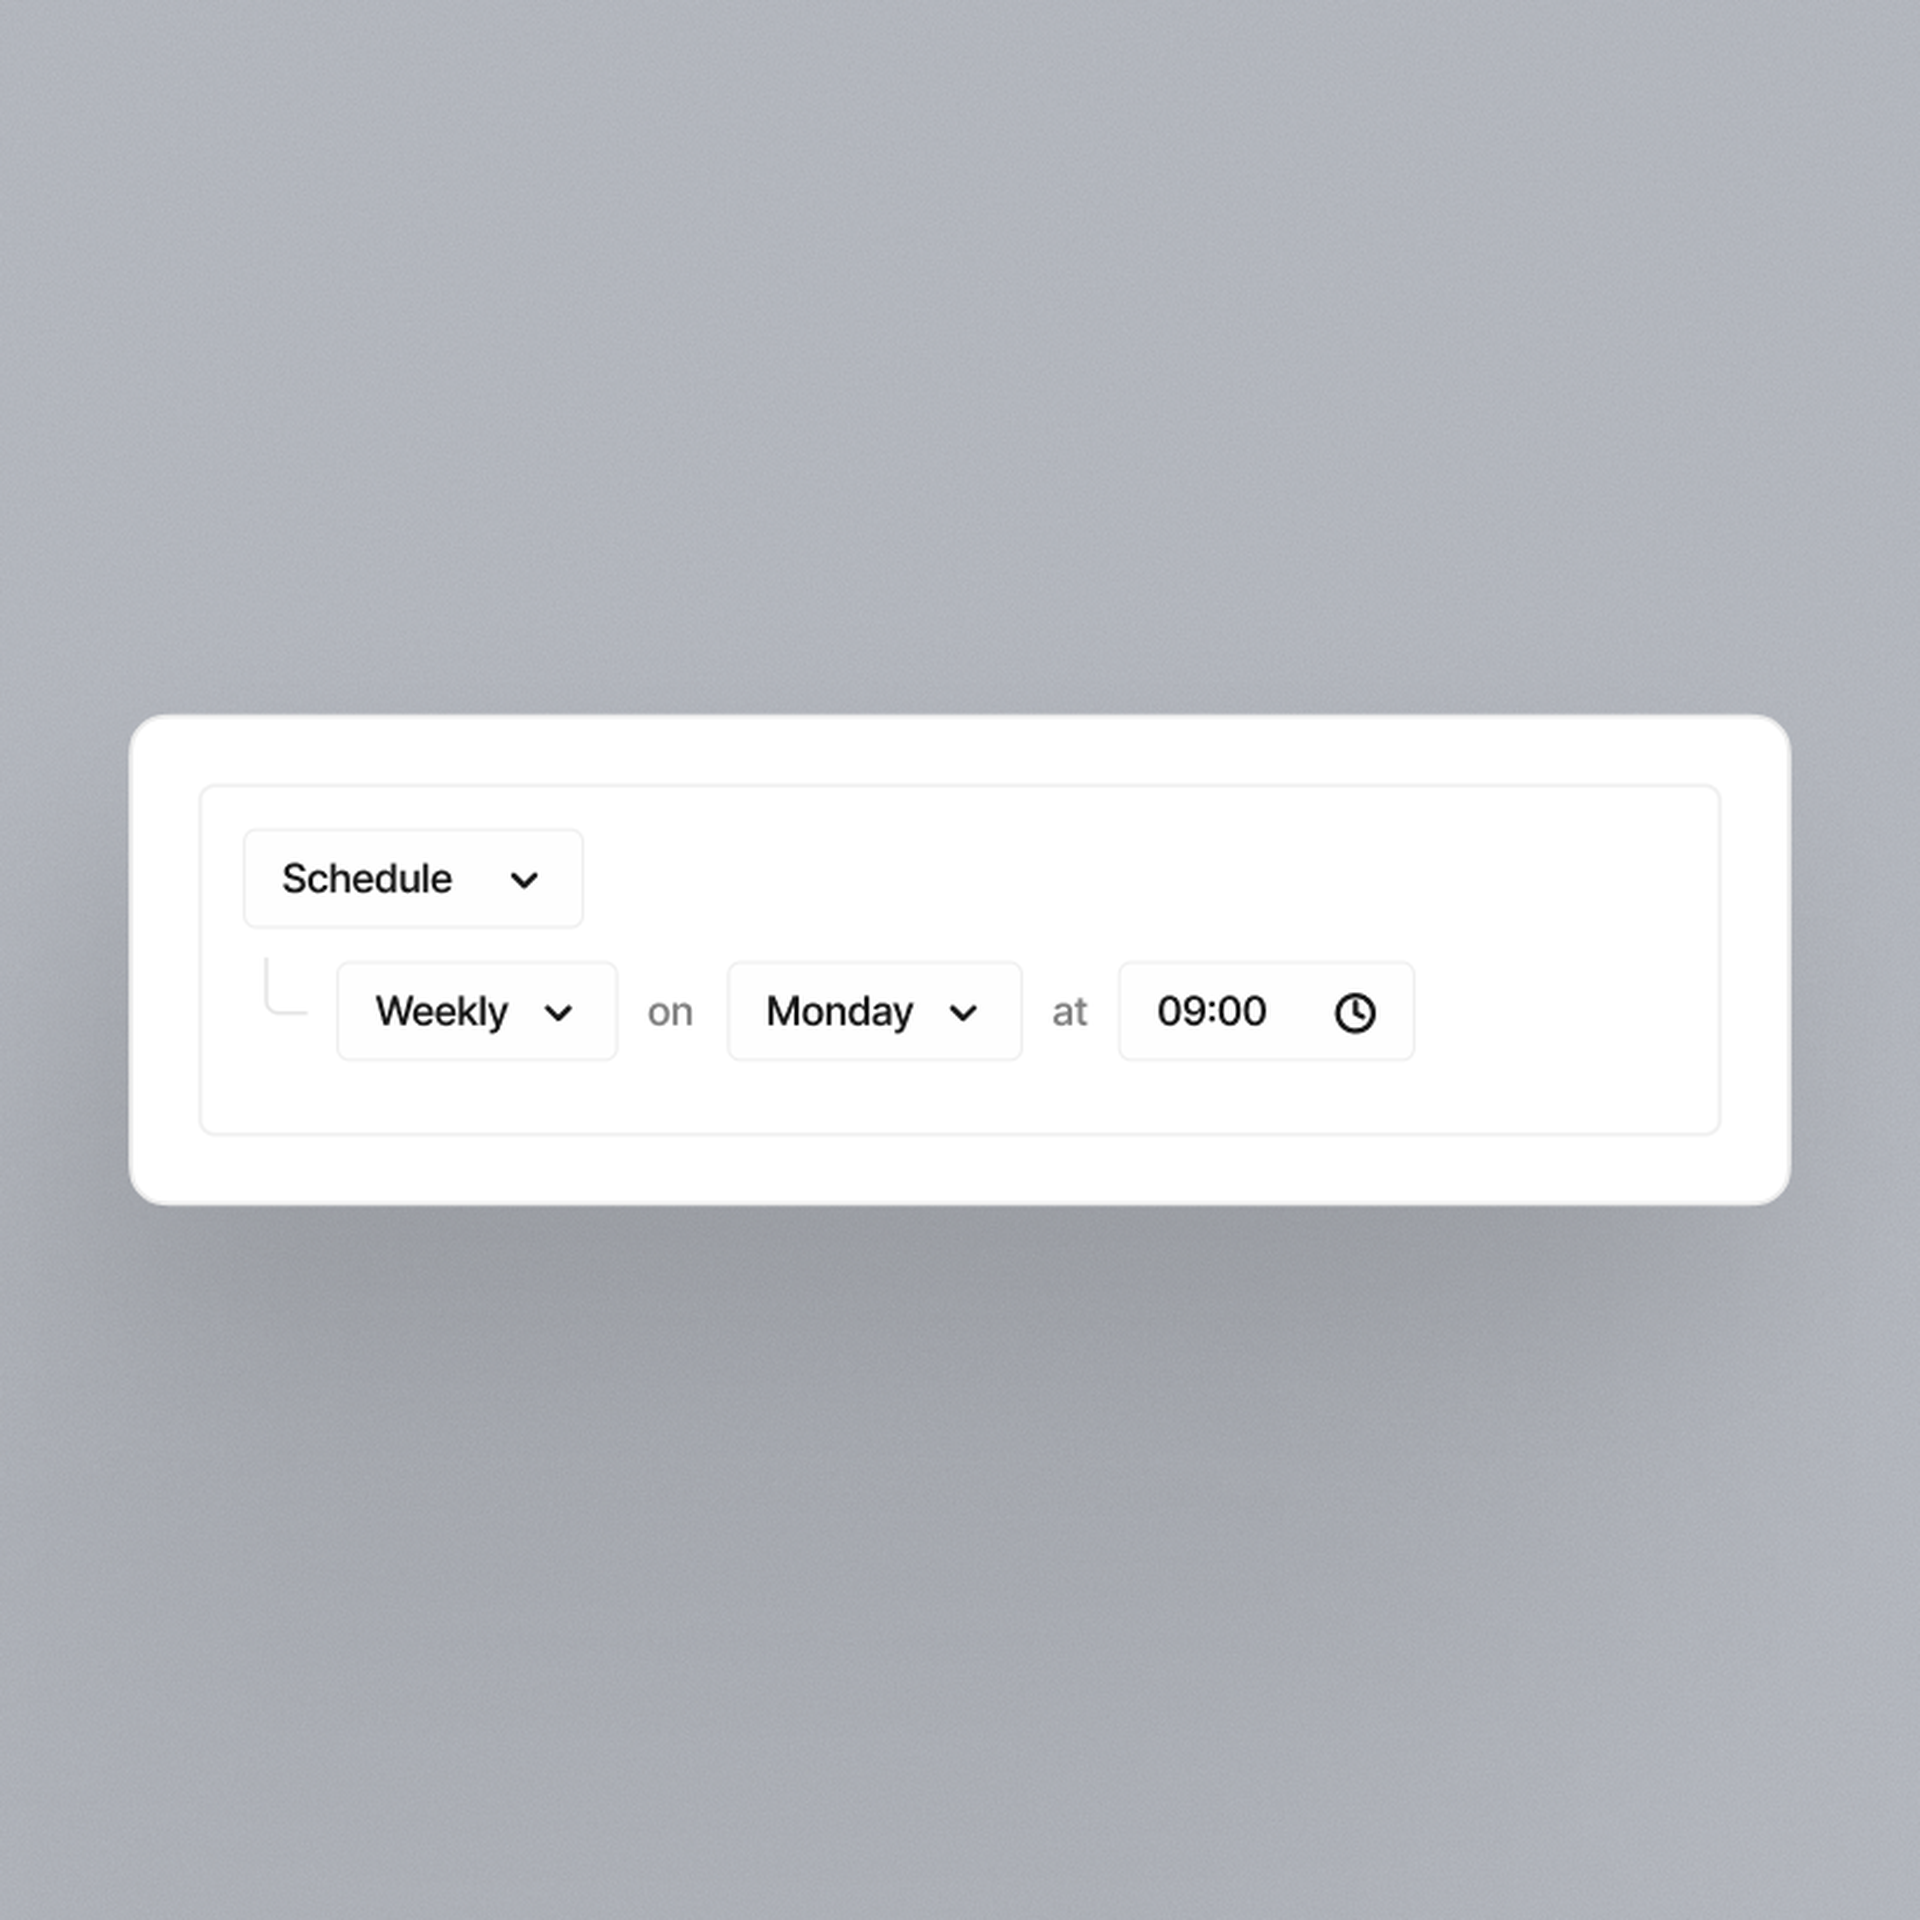
Automations
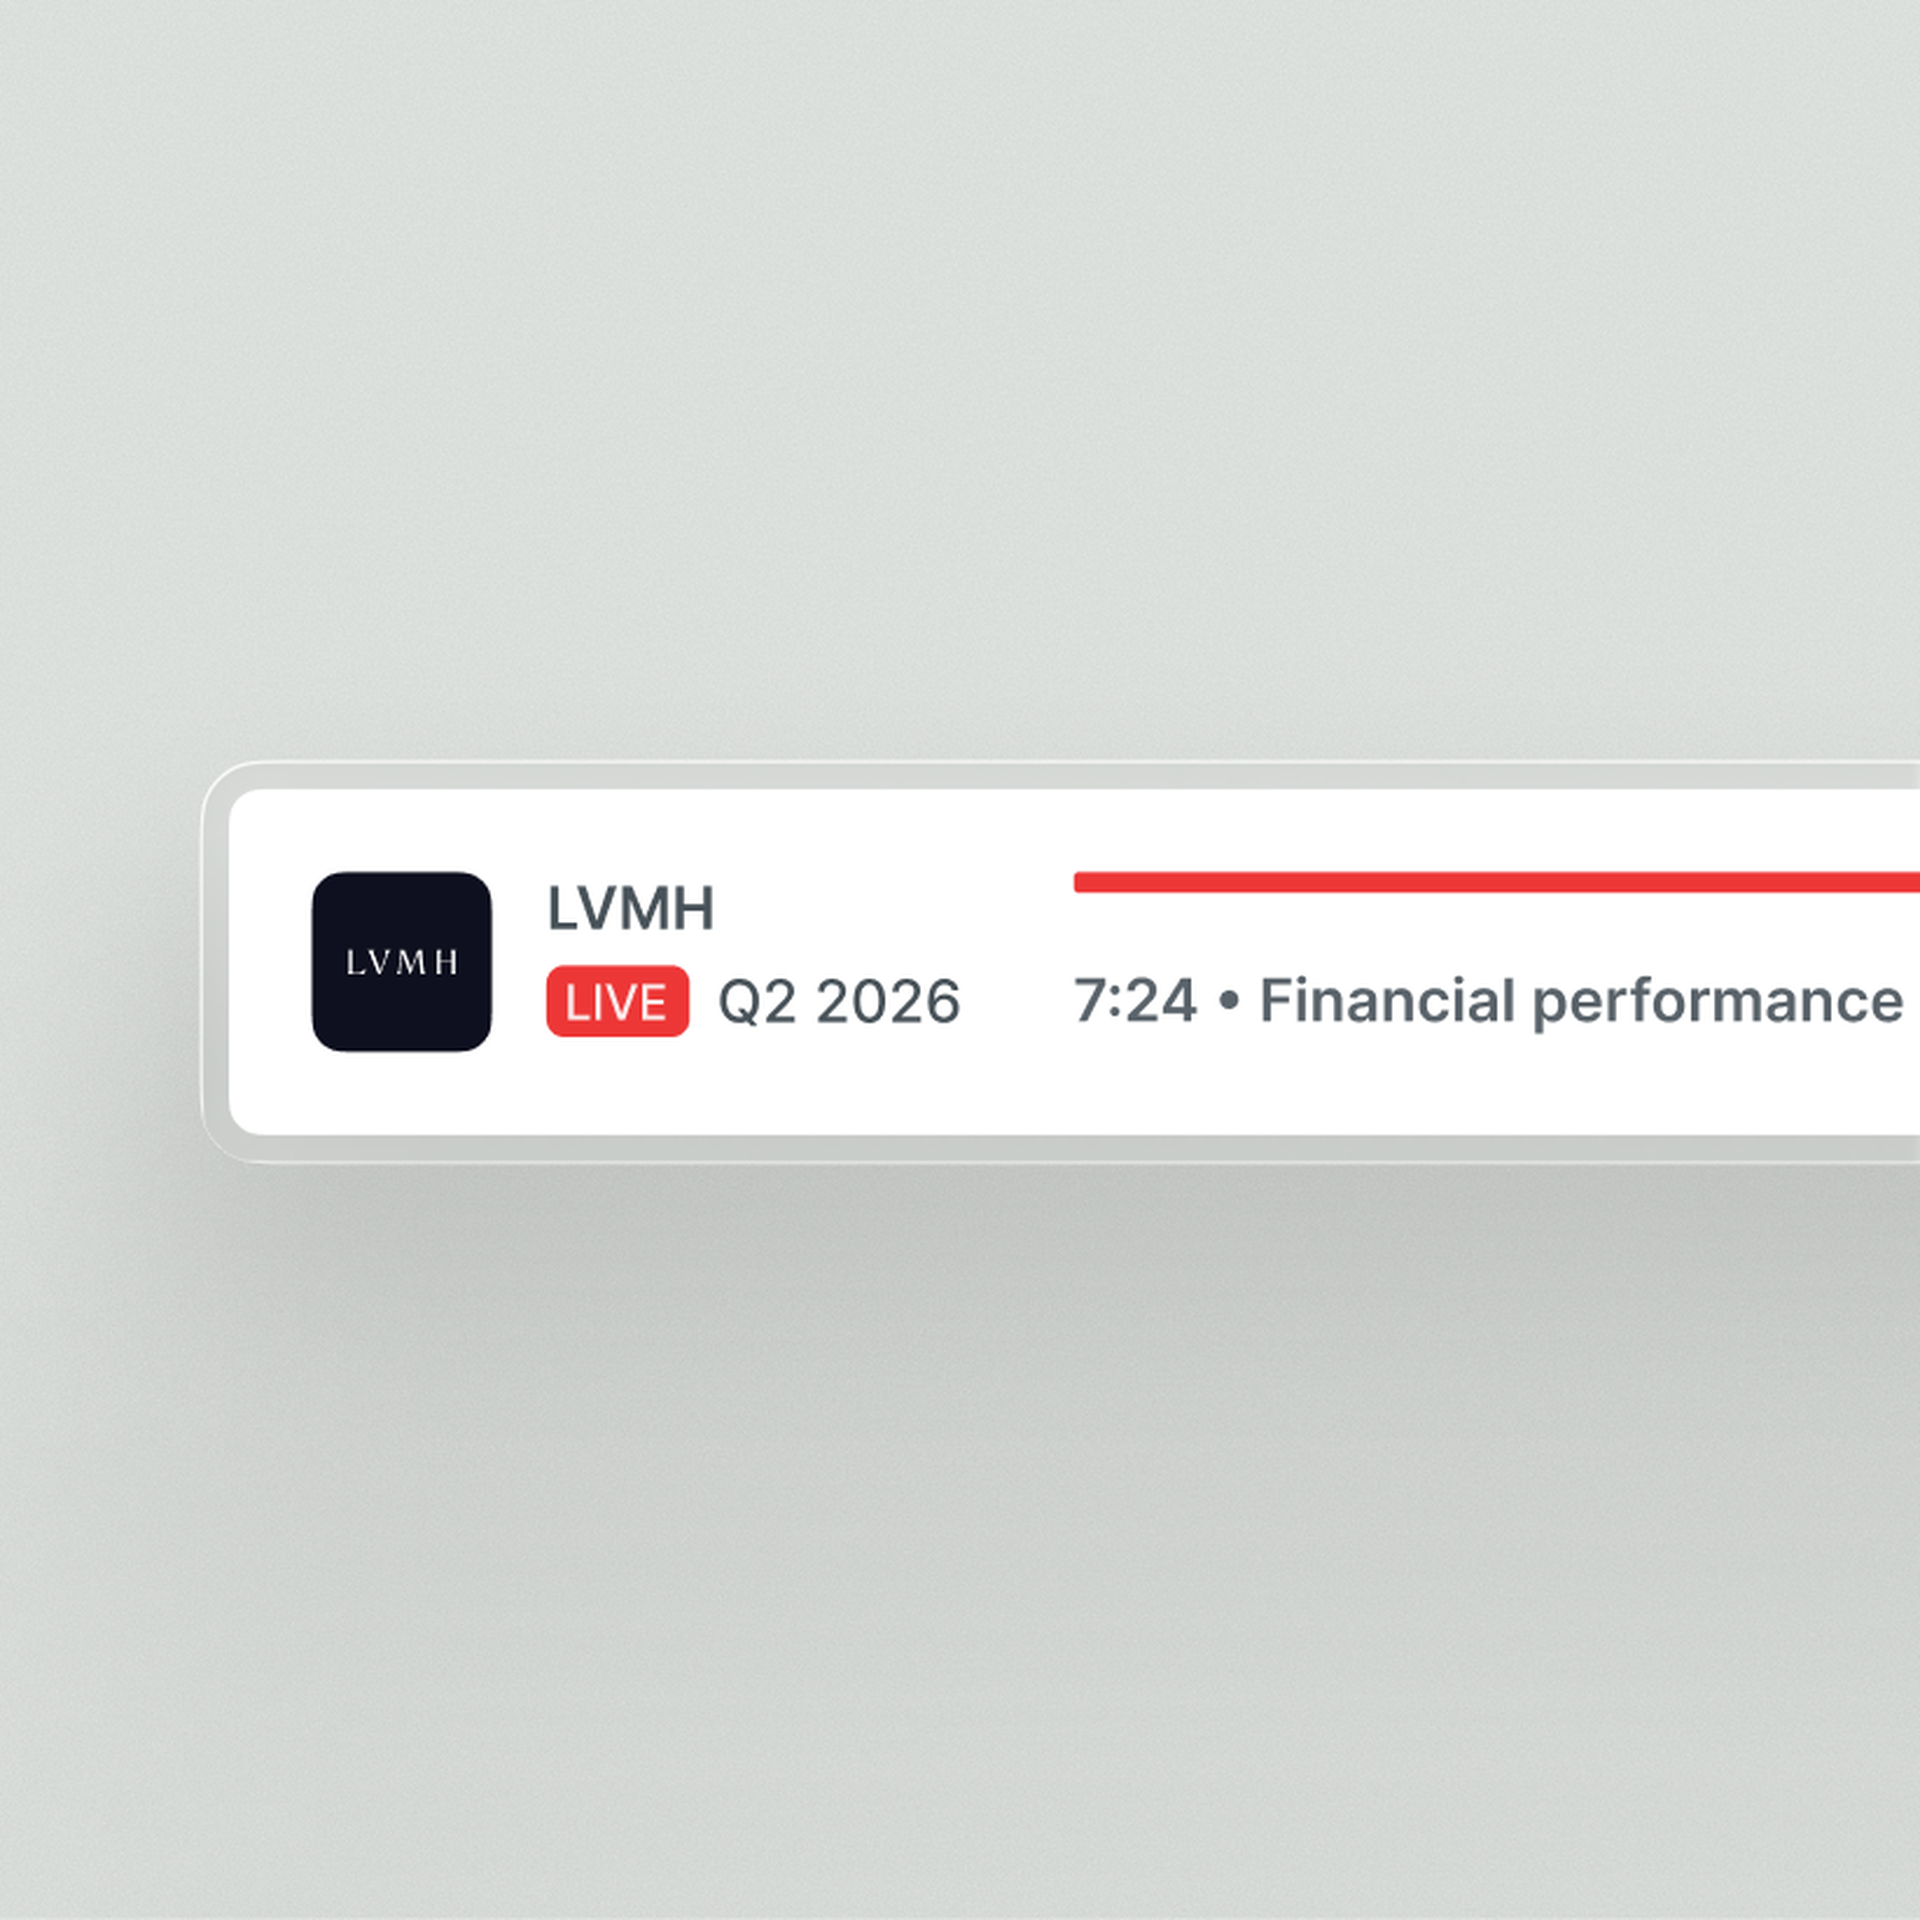
Live audio & transcripts
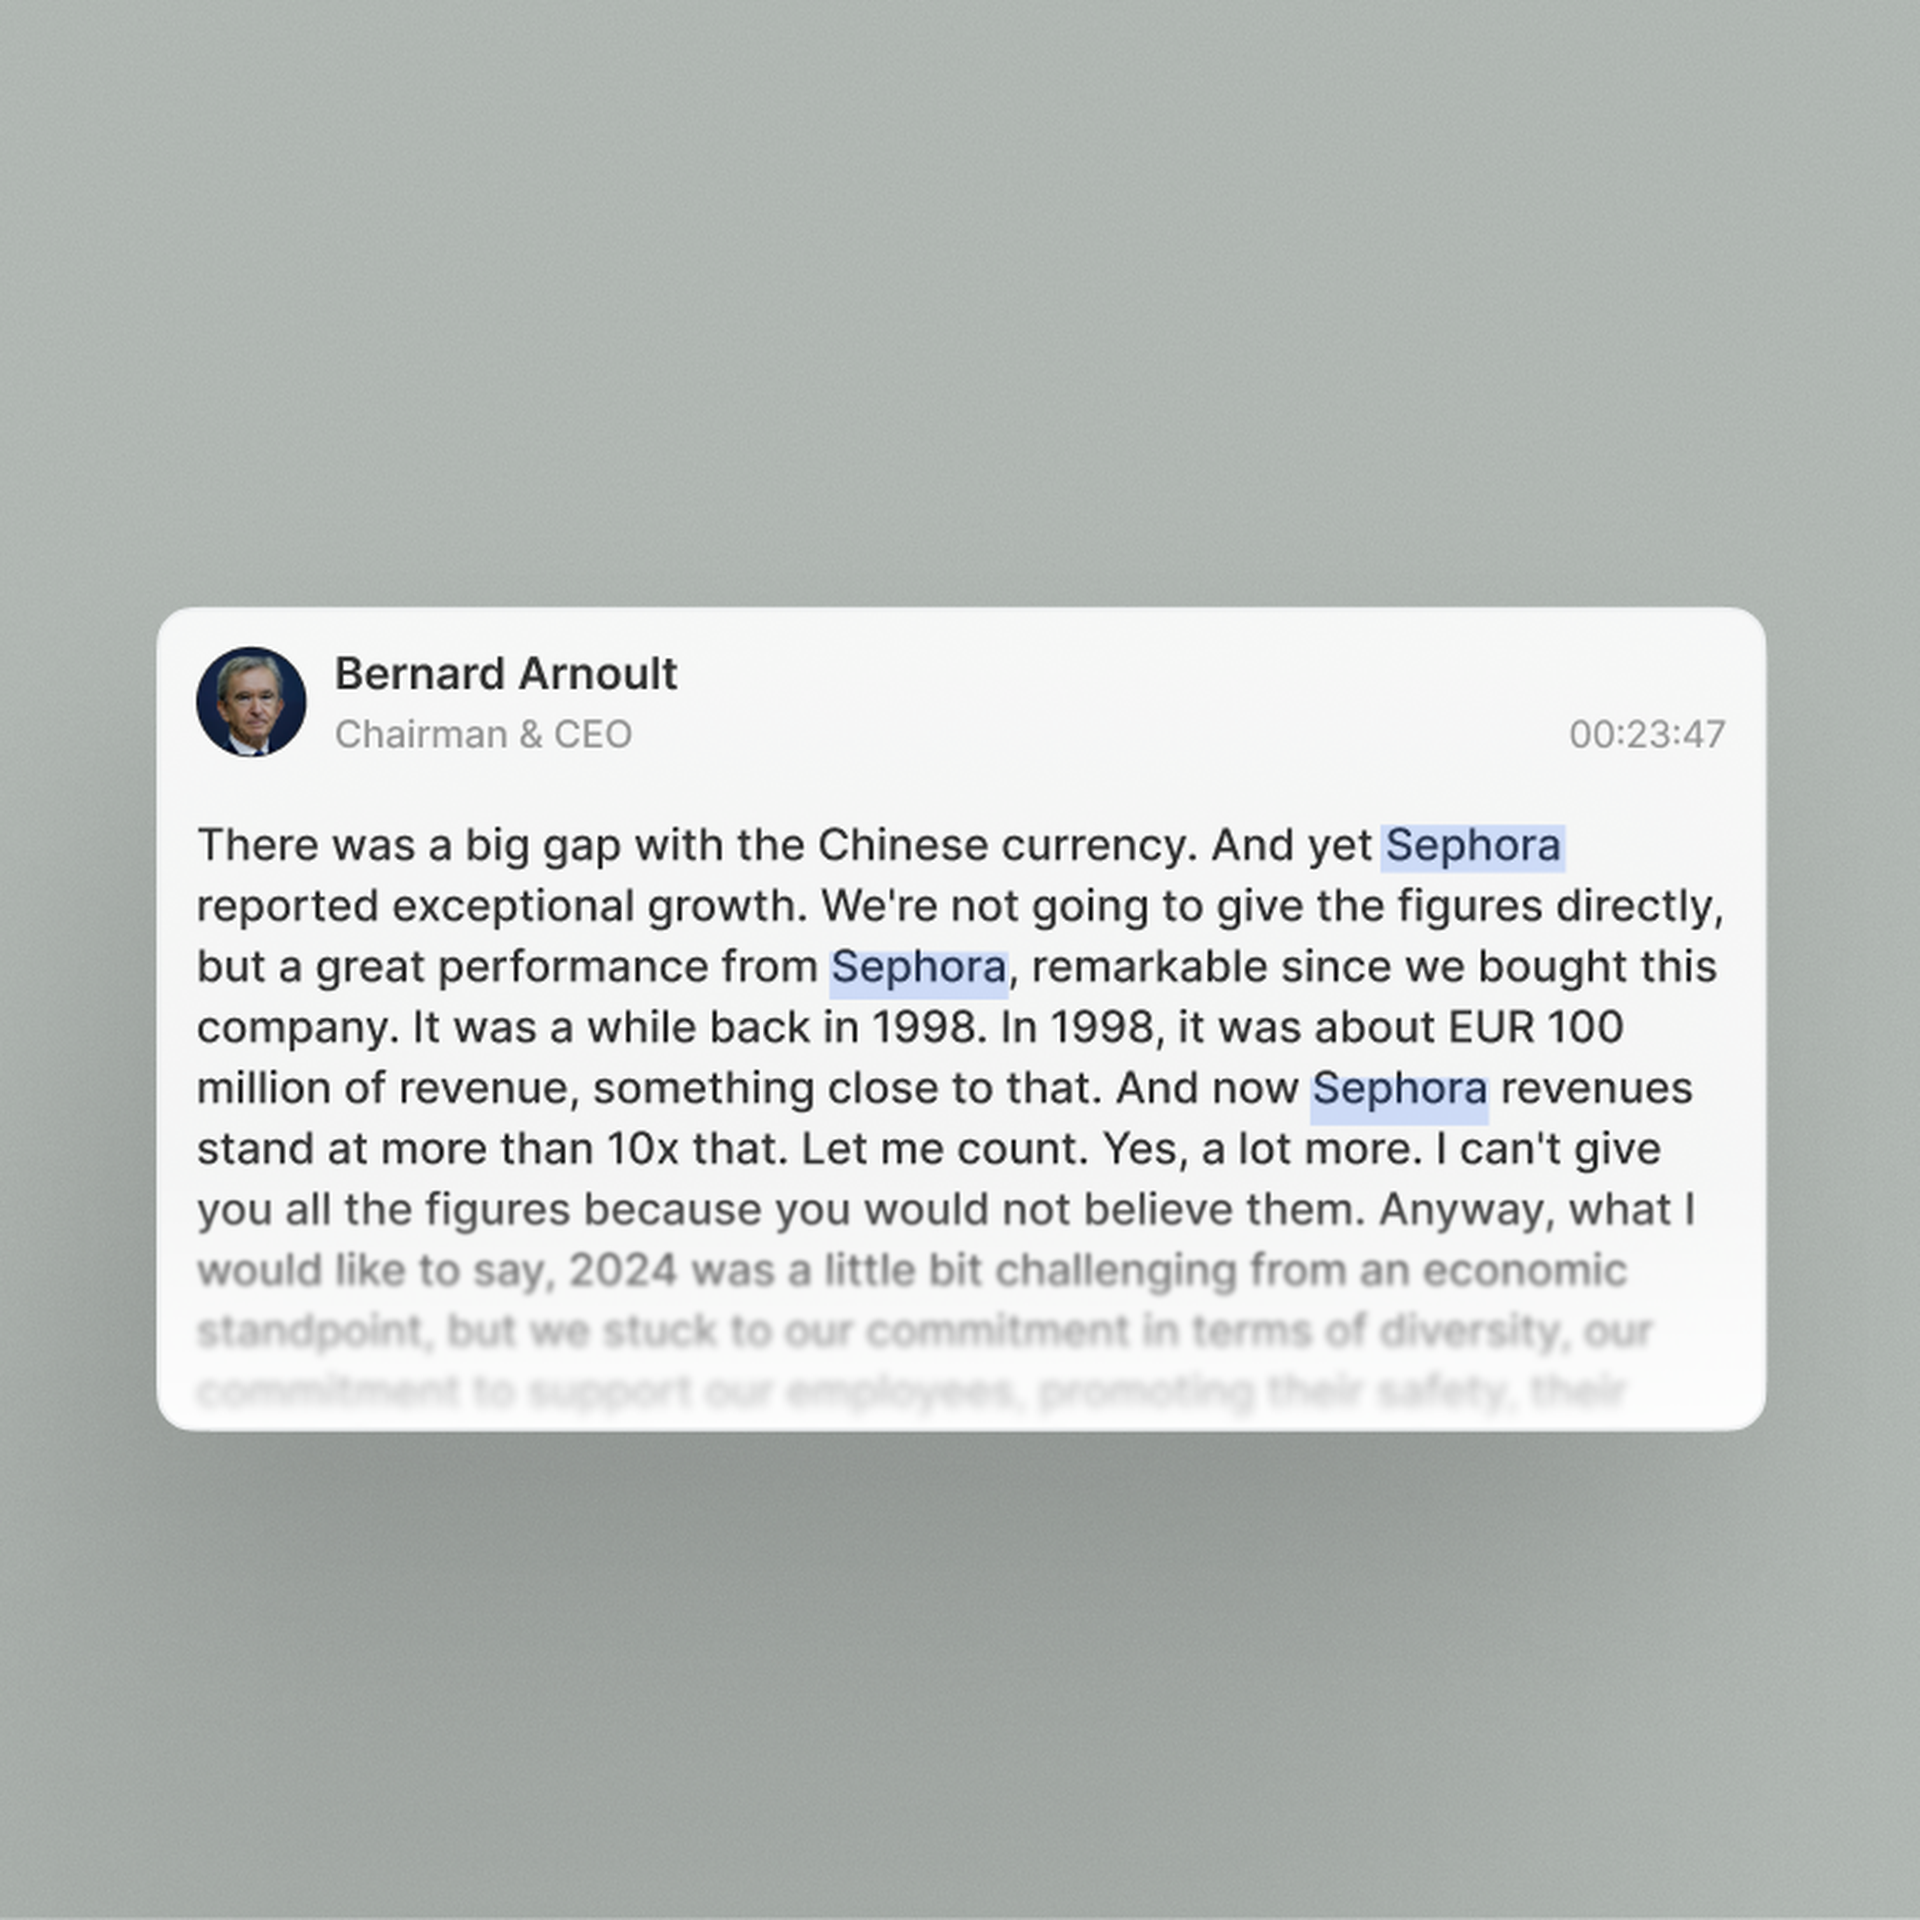
Quartr's AI stands out because it only pulls clean, first-party data from public companies. In investing, that's everything.
Jamie Ross
Investment Manager, GAM Investments
Research that used to take hours now takes seconds with Quartr Pro. Tracking shifts in tone or extracting tables, it's as simple as typing a query.
Tom O'Hara
Investment Director
Before Quartr we spent hours manually compiling insights through the peer earnings cycle. Now, these tasks are done faster, with greater precision.
Gregg Lampf
VP of Investor Relations
Being able to ask specific questions across years of transcripts and reports and instantly get verified answers is a game-changer.
Pontus Dackmo
CEO & Investment Manager