Edge16 Oct 2026
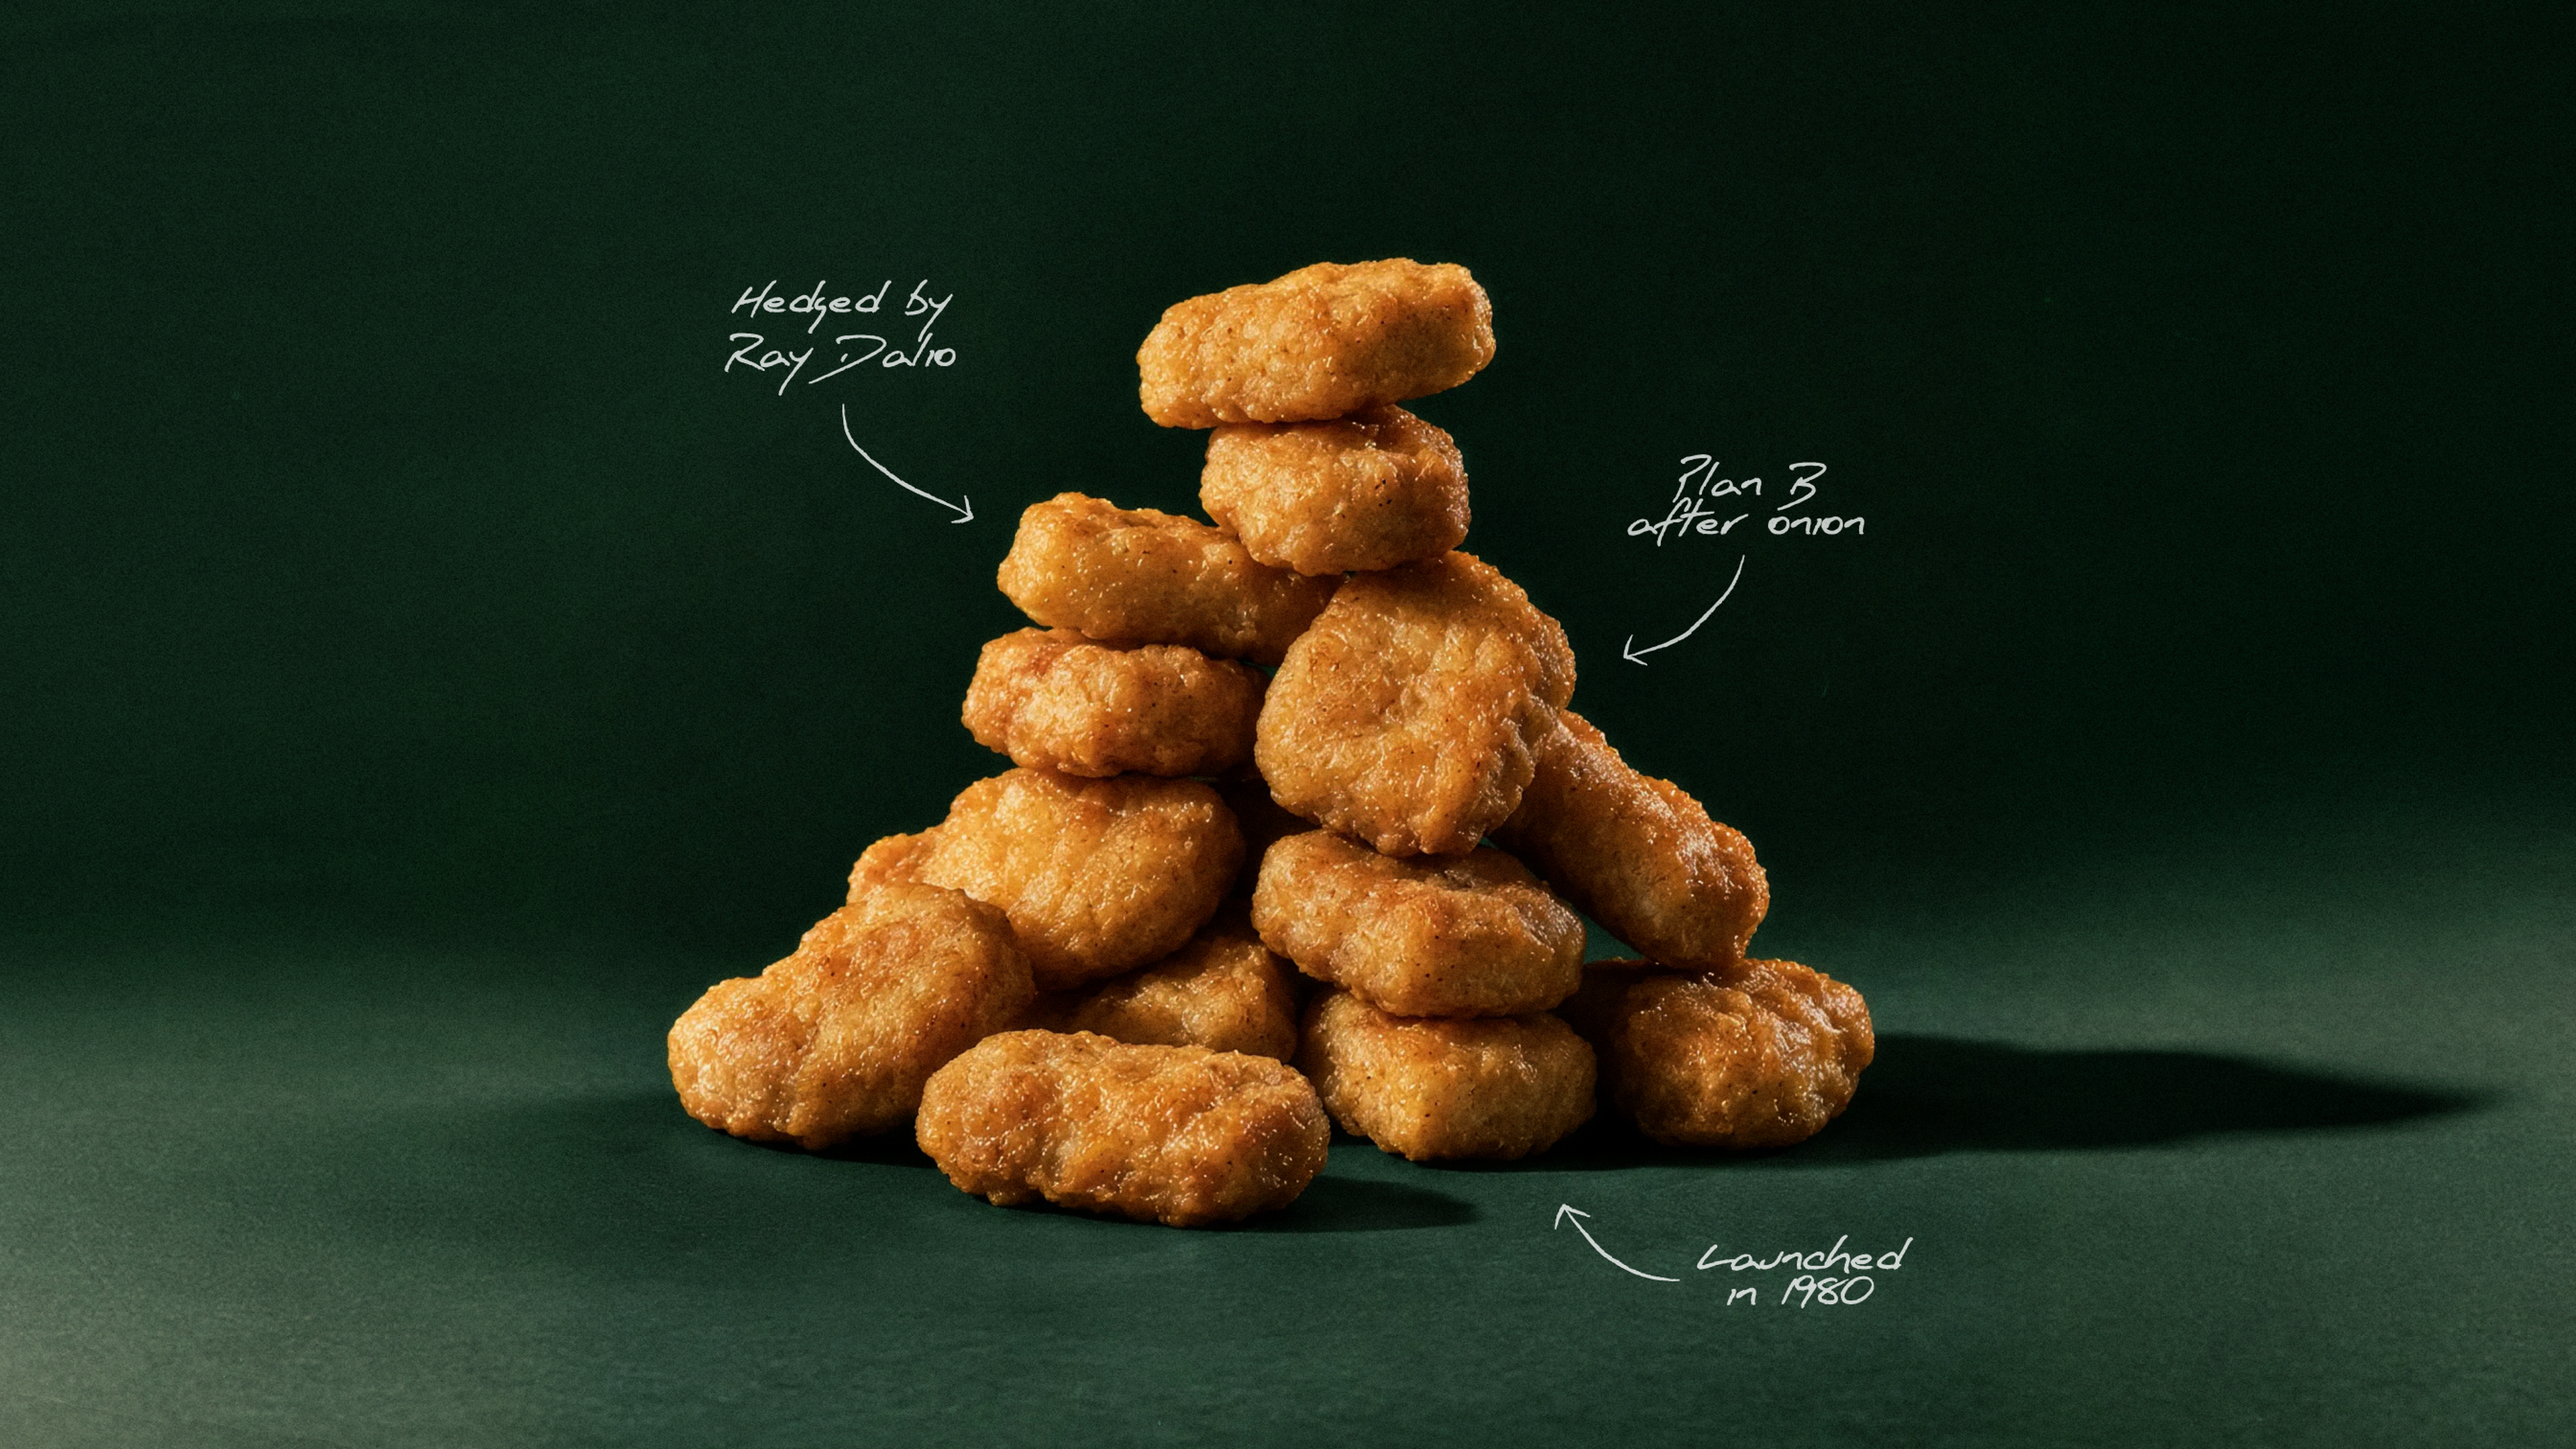
Winner, Winner: The Chicken McNugget Story
How a 1940s breeding contest, a Cornell food scientist, and a hedge by Ray Dalio helped McDonald's turn the Chicken McNugget into a fast-food icon.

Q3 FY2026 net sales rose 18.3% to $26.1 million from $22.1 million; continuing operations recorded a $40,000 loss, or $0.01 per diluted share, versus $3.3 million income a year earlier.
Nine-month net sales increased 23.5% to $76.6 million from $62.0 million, with continuing-operations income of $4.4 million versus a $0.4 million loss.
Q3 gross profit was $3.4 million versus $5.9 million; excluding the prior-year $2.4 million ERC benefit, it decreased $0.1 million YoY. Nine-month gross profit rose to $14.3 million from $8.4 million, or $8.3 million excluding that benefit.
Q3 operating profit was $286,000 versus $3.3 million; nine-month operating profit was $5.5 million versus $567,000.
Q3 EBITDA was $1.3 million versus $5.3 million, while Adjusted EBITDA was $4.8 million versus $4.4 million; nine-month EBITDA was $8.6 million versus $4.9 million and Adjusted EBITDA was $13.5 million versus $4.0 million.
Nine-month operating cash flow was $3.4 million, compared with $0.6 million used in the prior year; working-capital changes used $8.3 million, largely from higher inventory, receivables and contract assets.
Q3 discontinued-operations income was $0.0 million versus $0.1 million in Q3 FY2025.
Strong customer demand and backlog provide visibility to future activity; focus is on converting demand into profitable growth and improving operational performance.
Backlog was $164.2 million at June 30, 2026, versus $130.4 million a year earlier; orders may be modified or canceled with limited charges, and backlog may not indicate future sales.
Remaining performance obligations totaled $164.2 million, with $99.2 million expected to be completed within 12 months.
Remaining FY2026 capital expenditures are expected to be $0.5–$0.7 million, principally for production and product capability enhancements and operating cost reductions.
Existing cash and available credit lines are expected to fund operations and planned capital expenditures for the next 12 months; operating cash flows are expected to support longer-term liquidity needs.

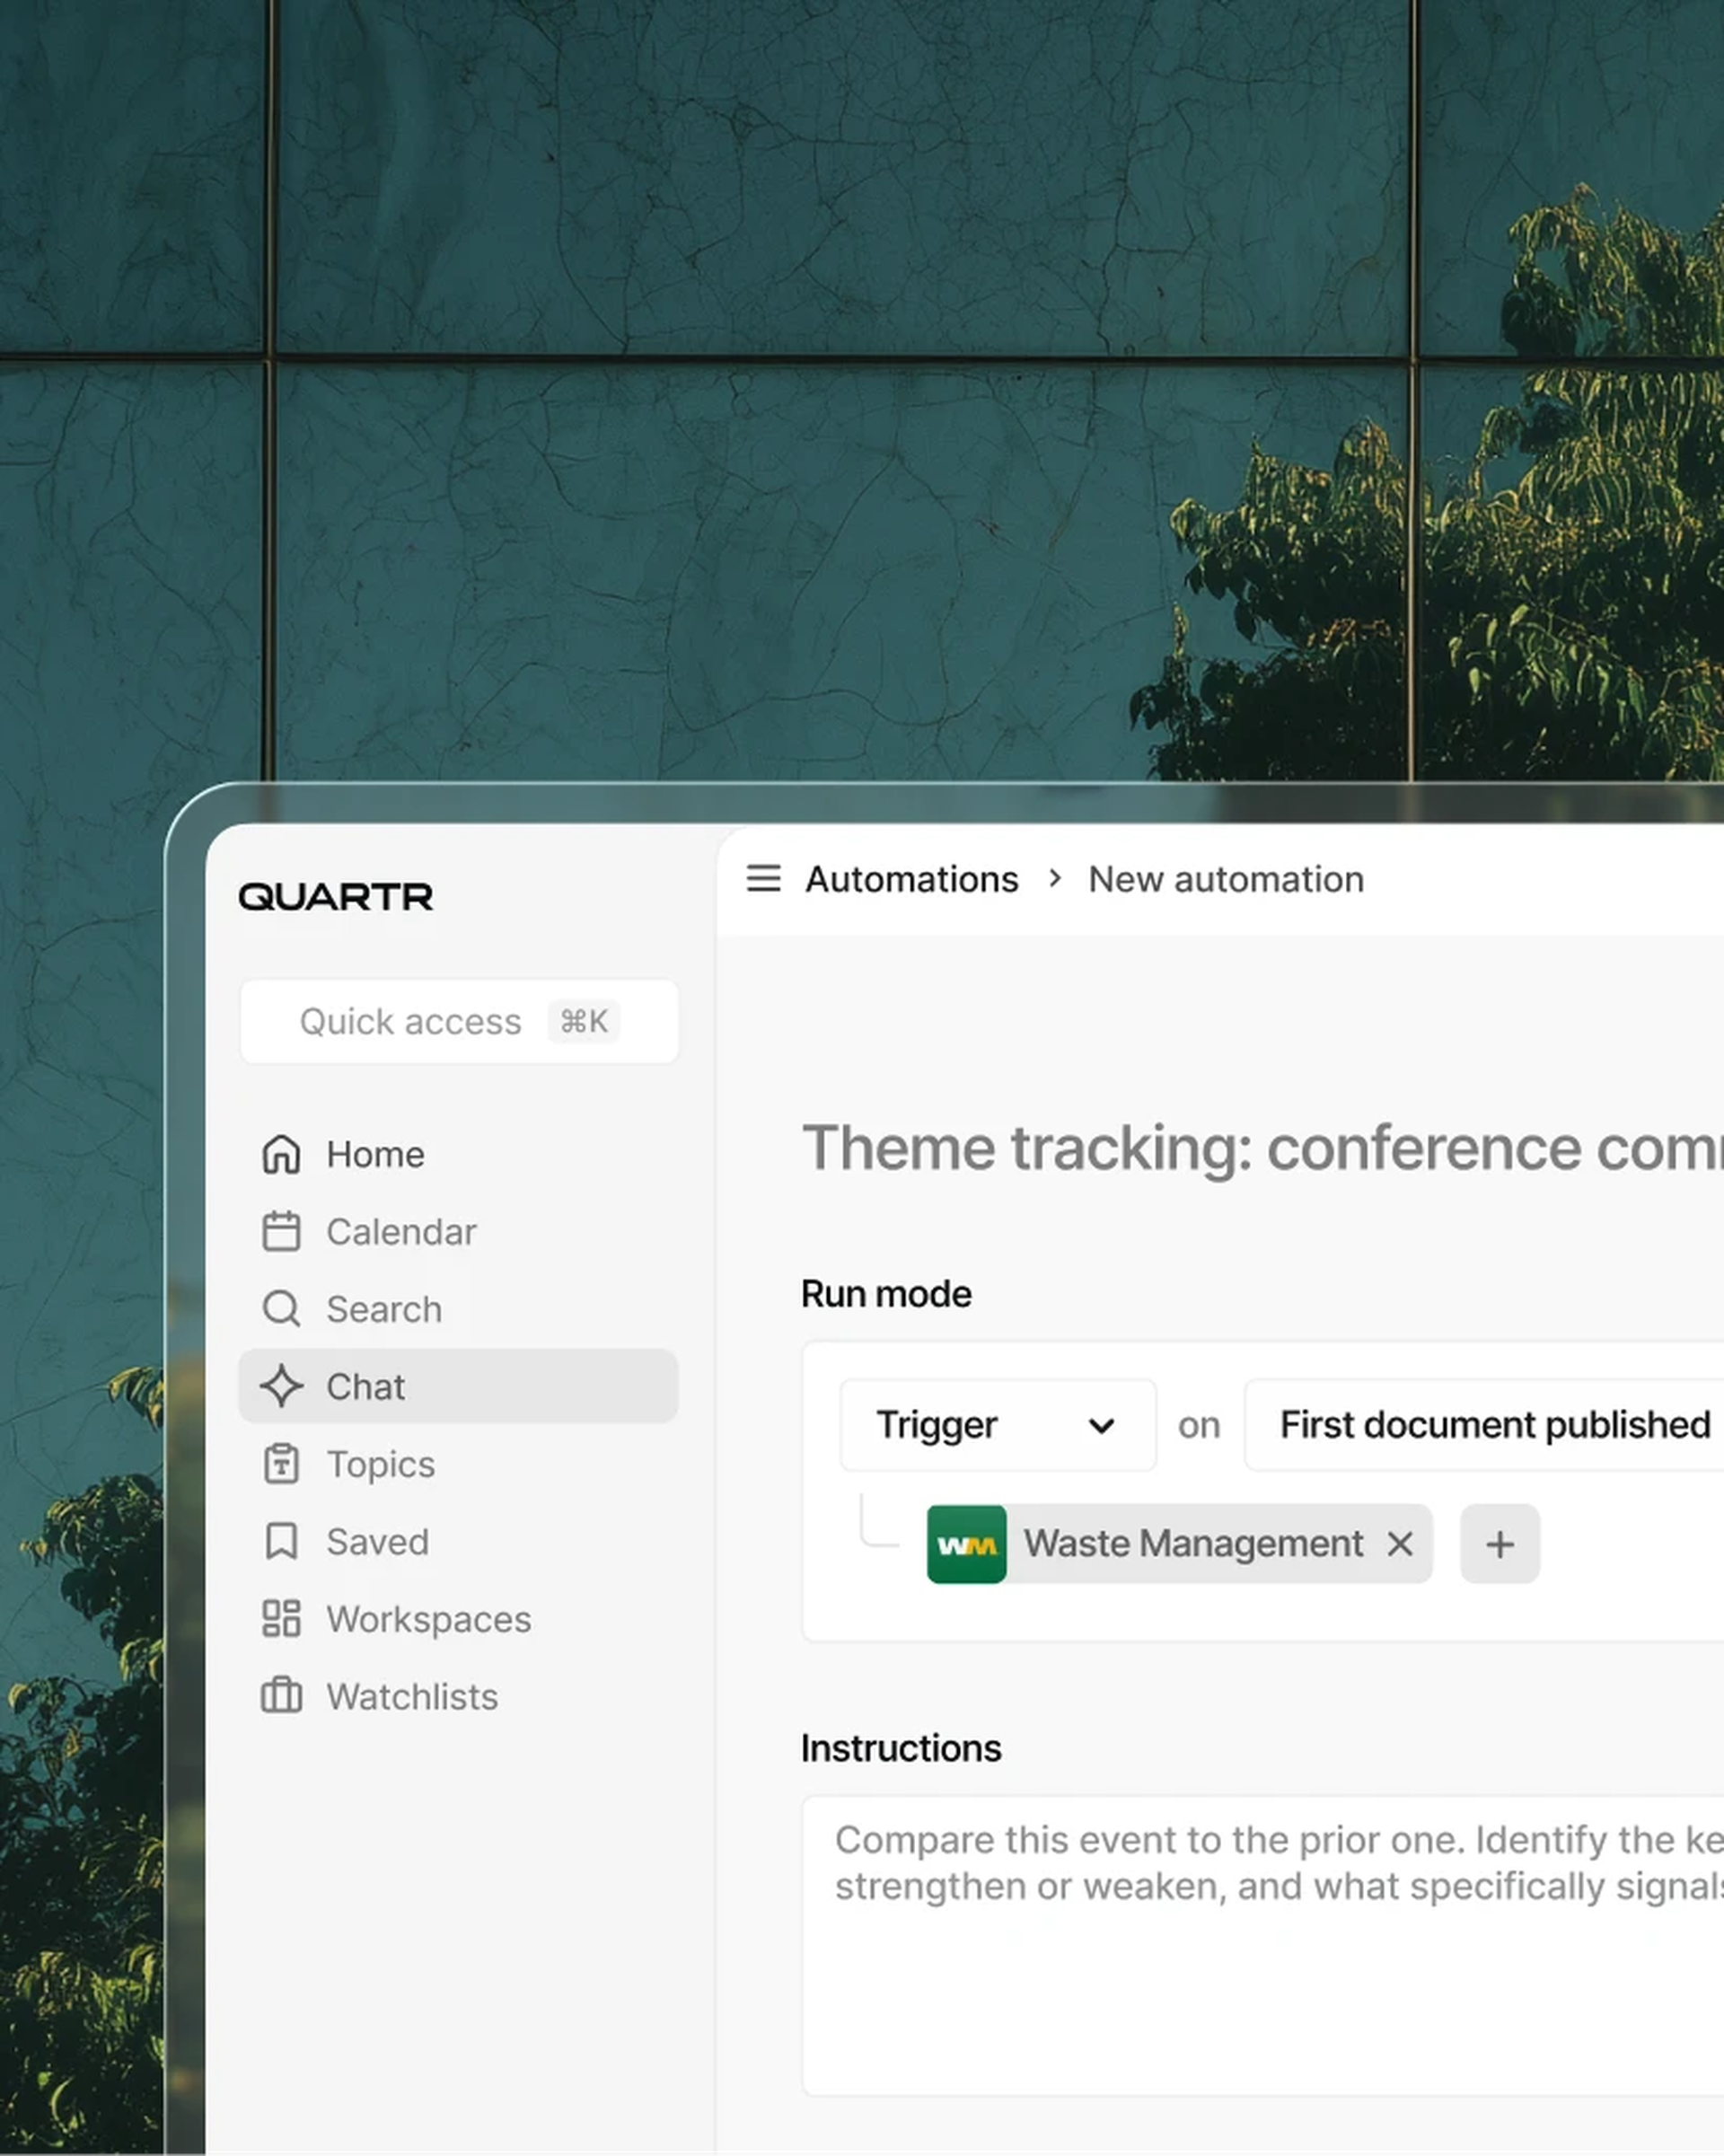
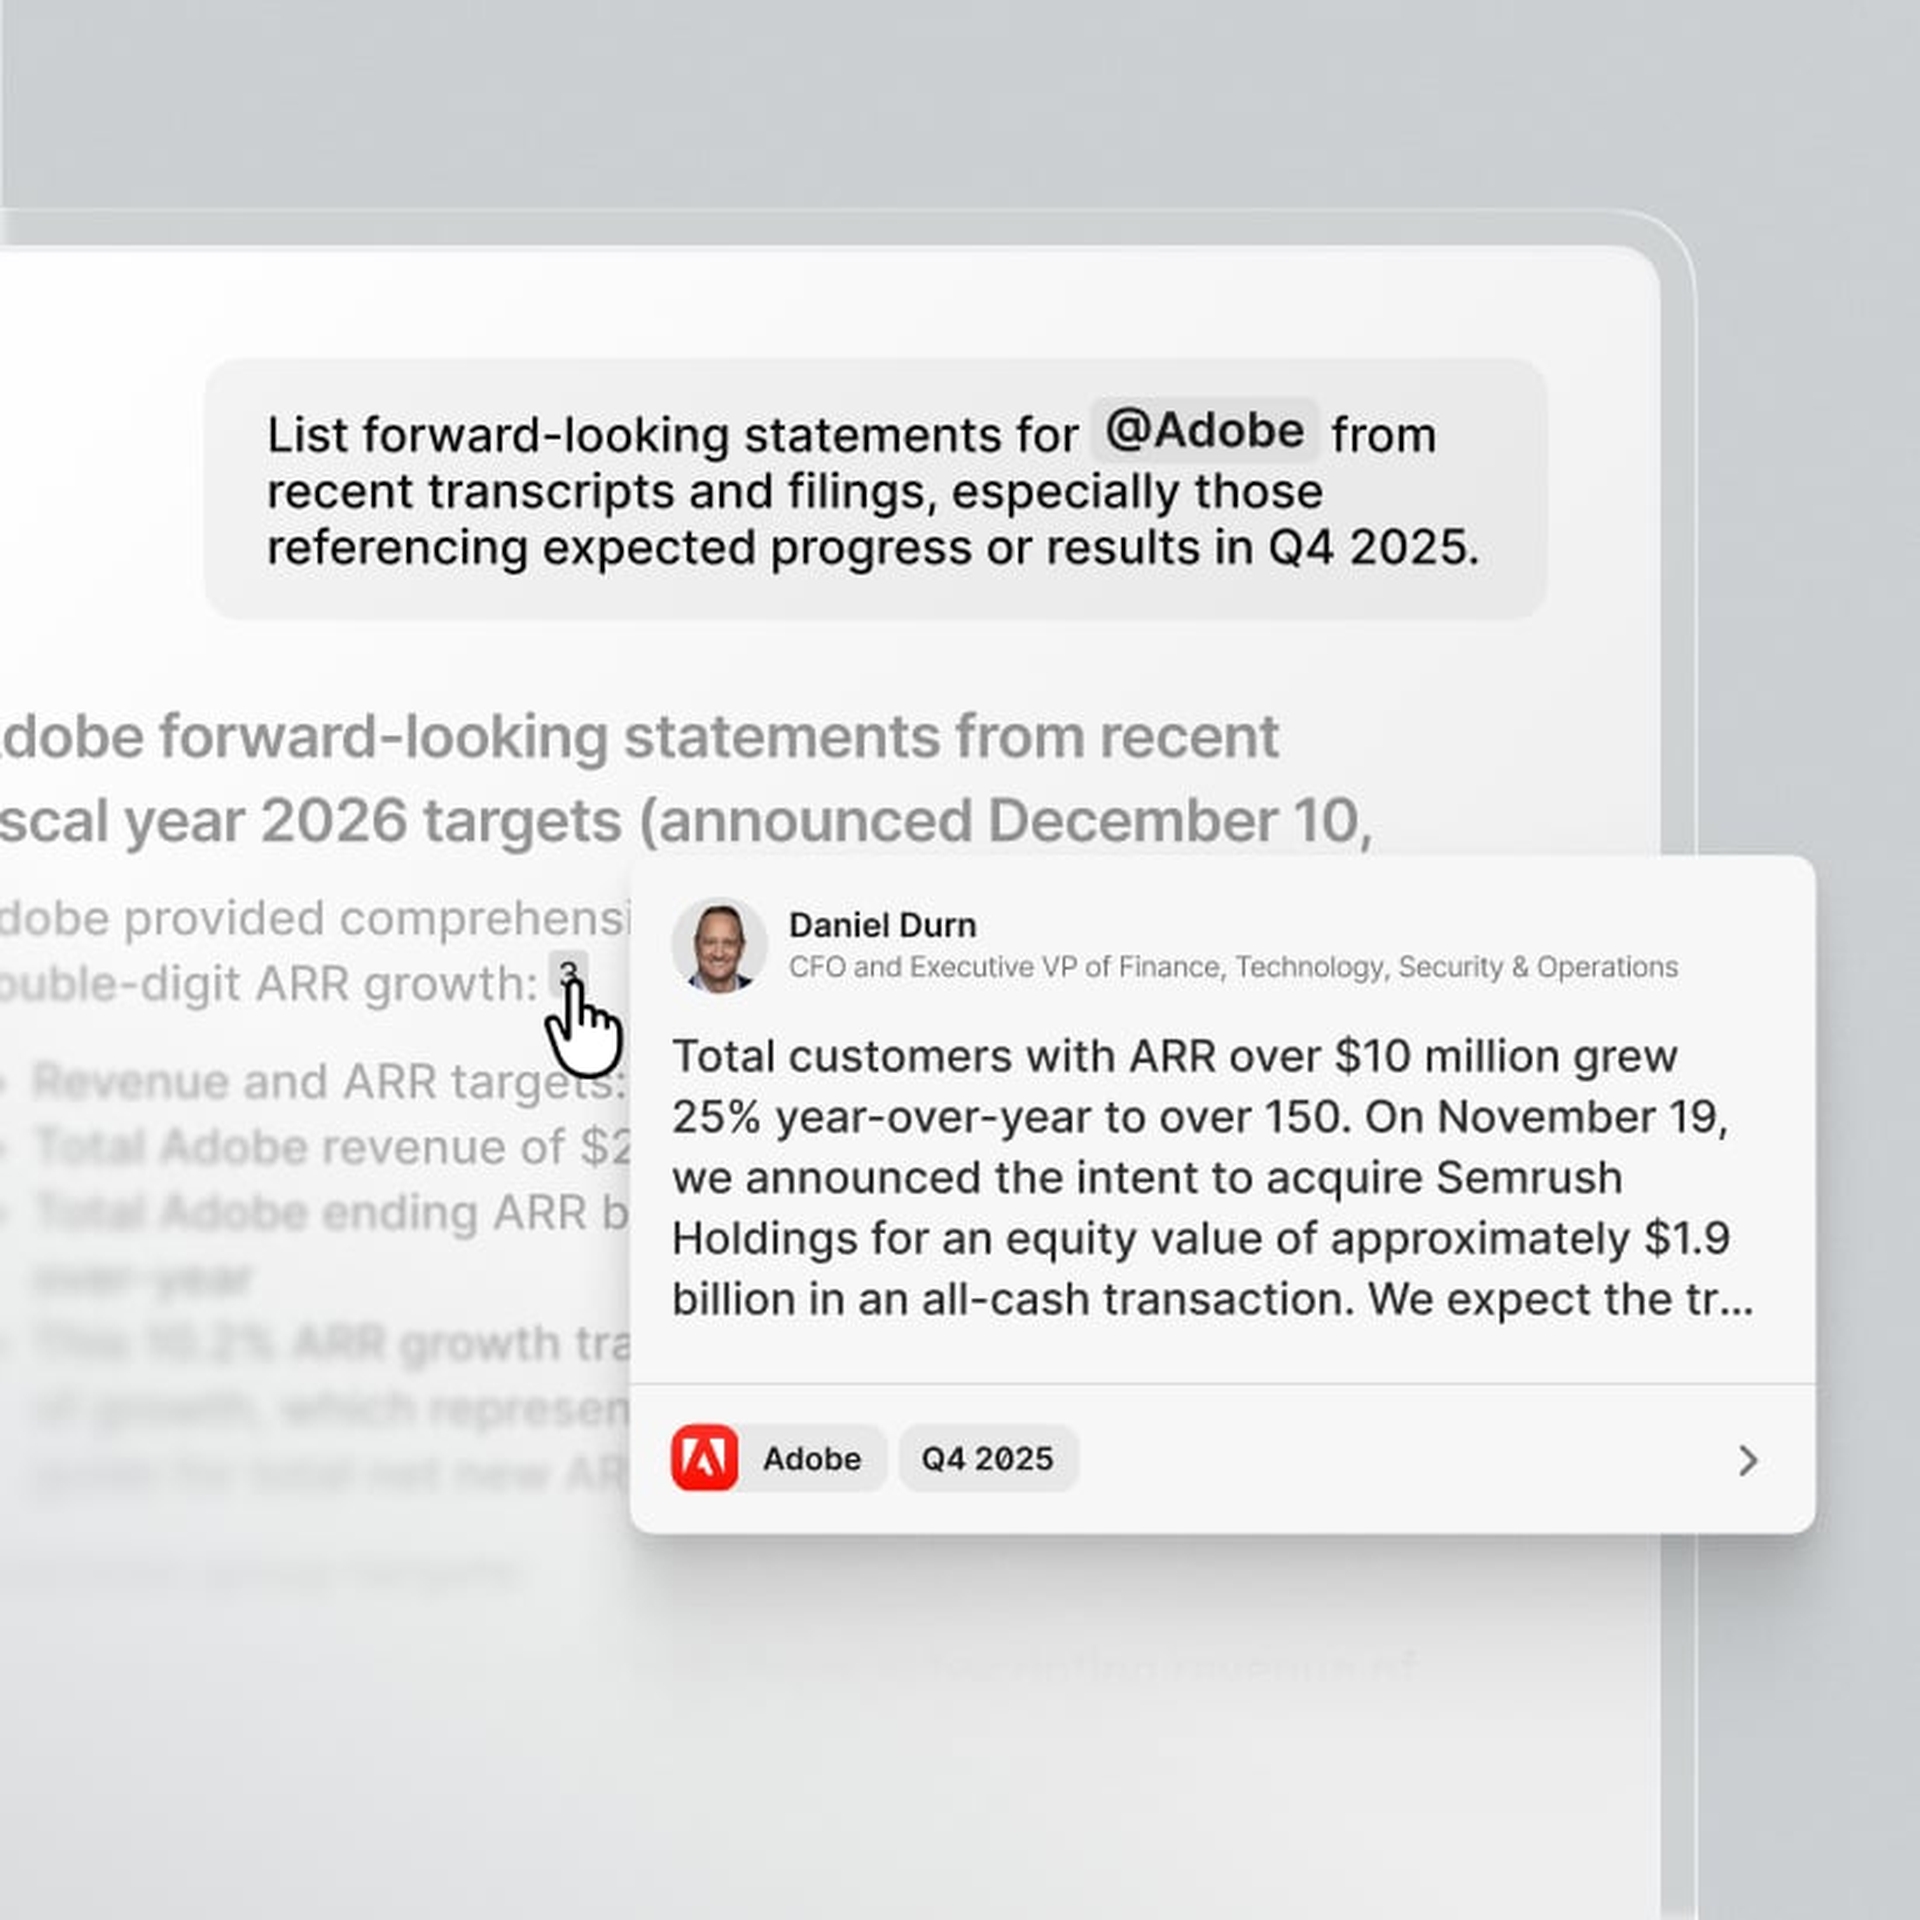
AI chat
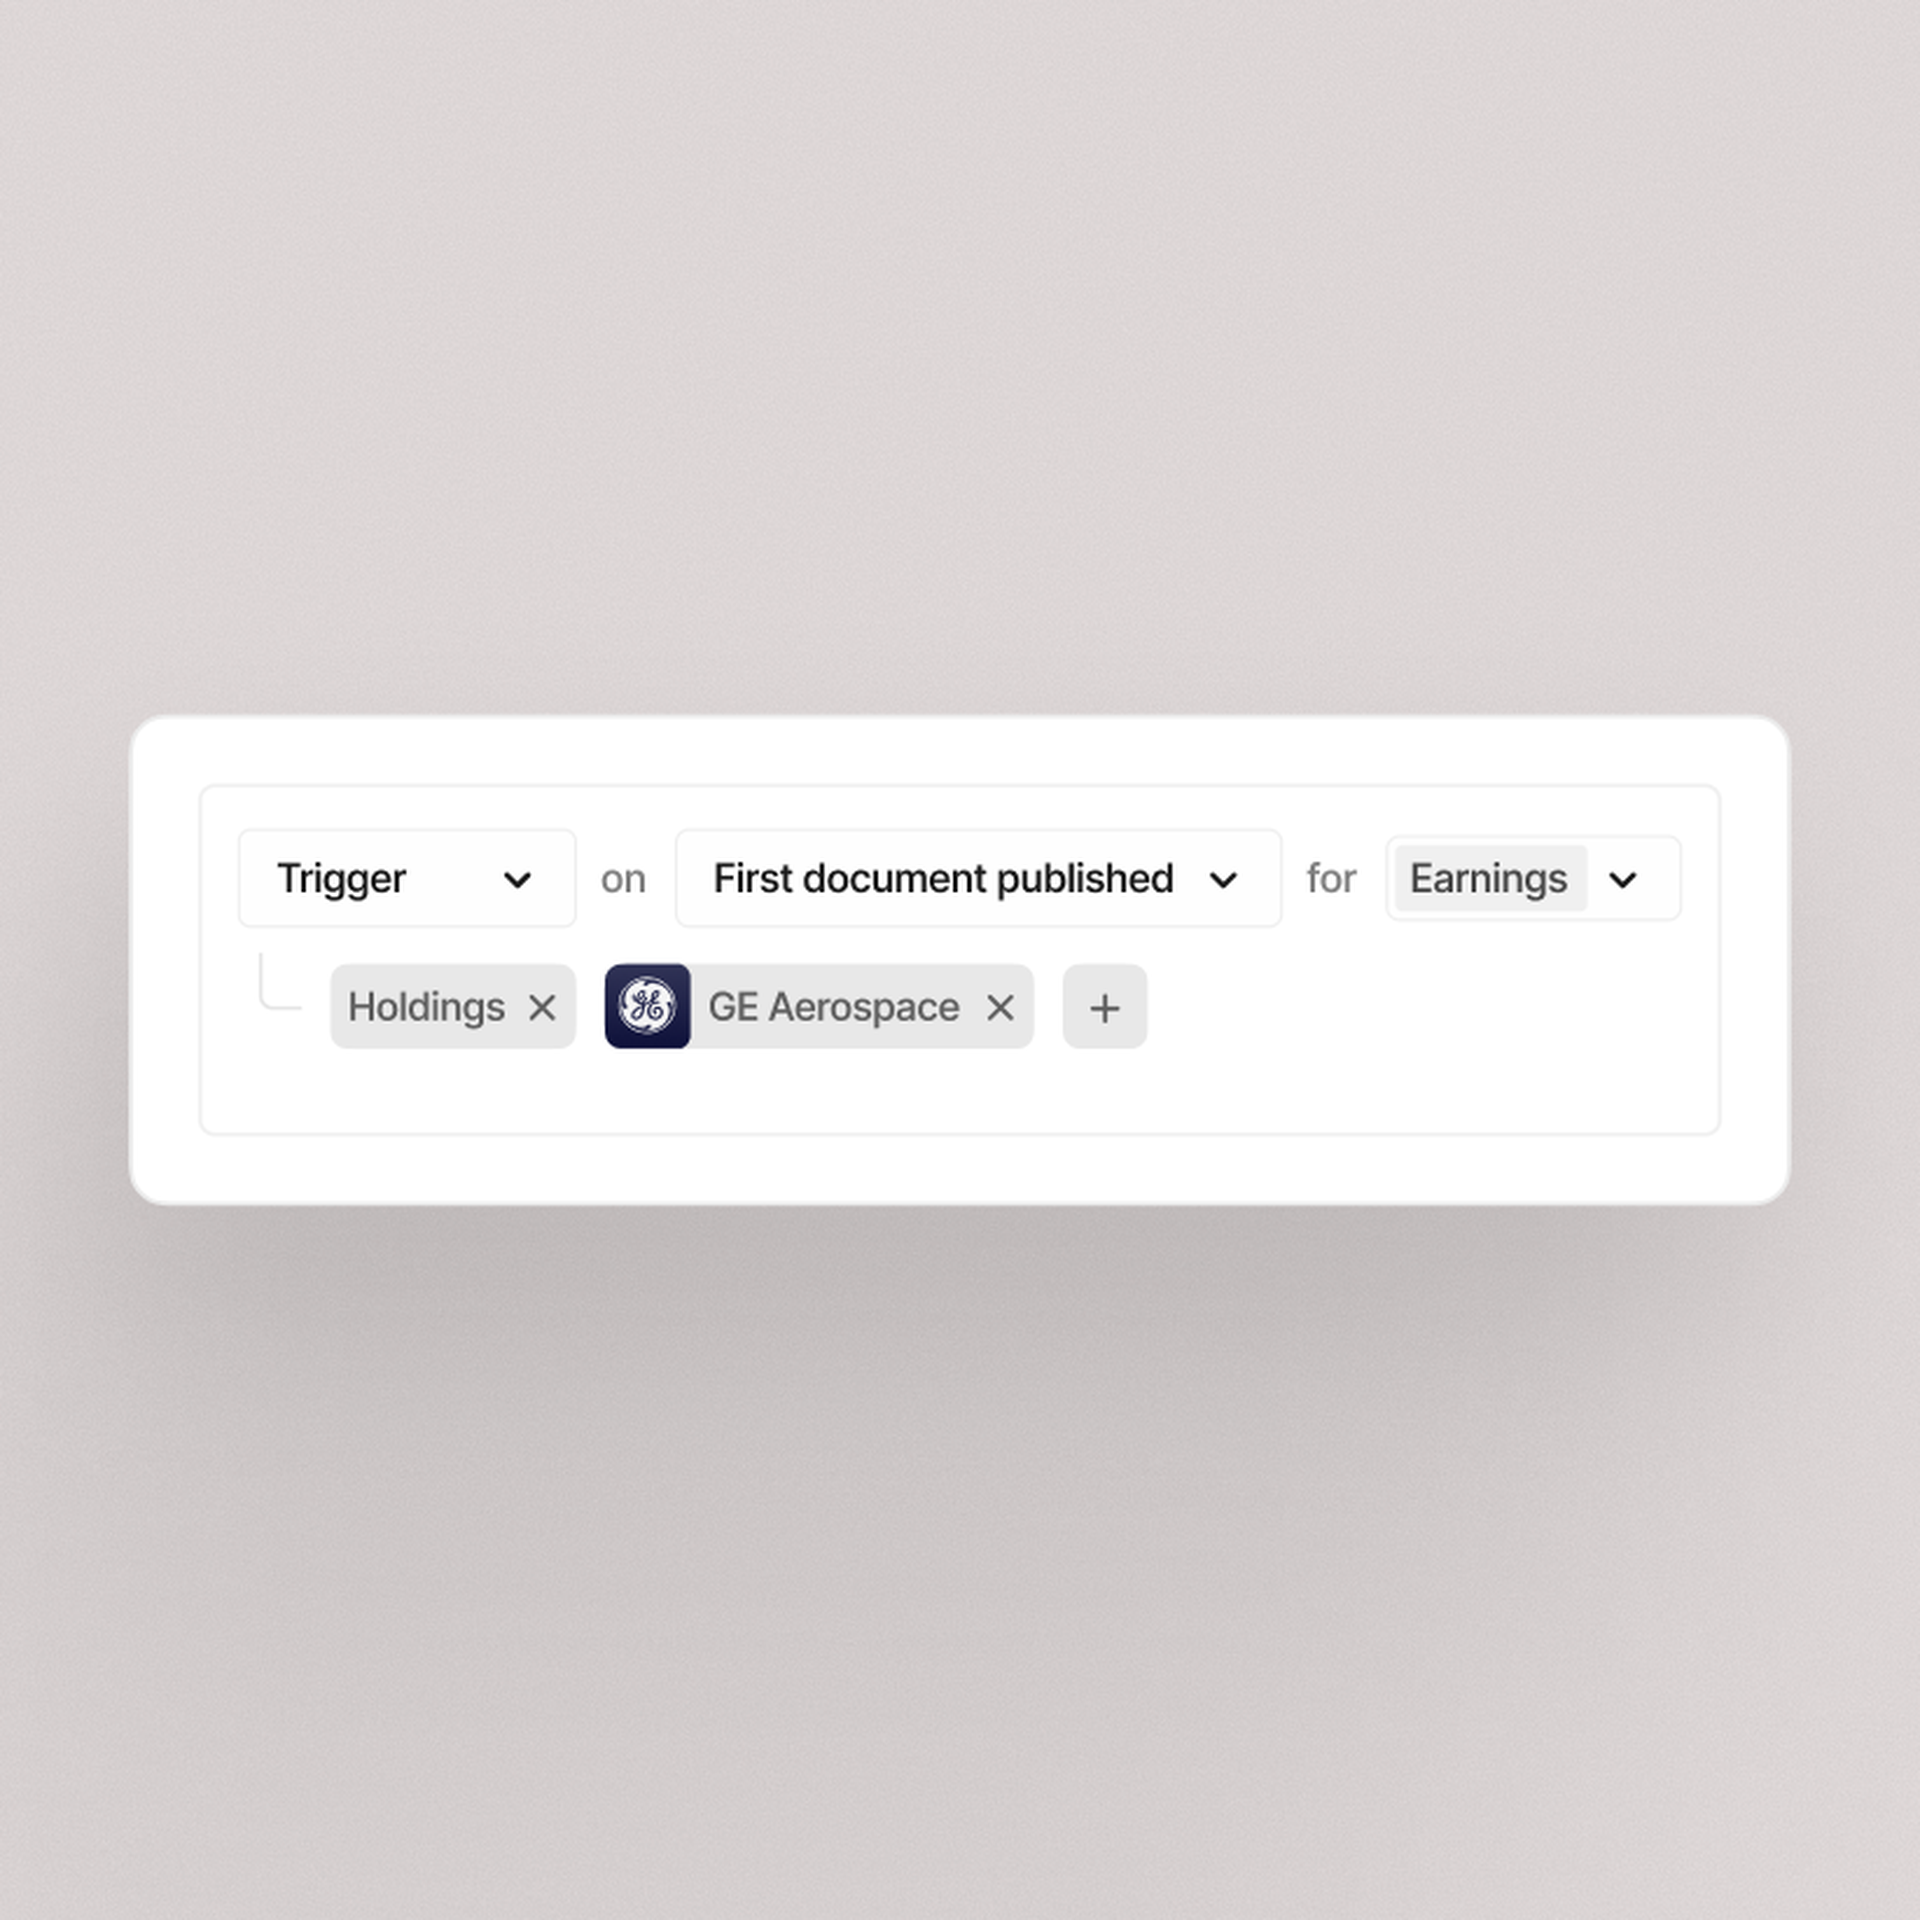
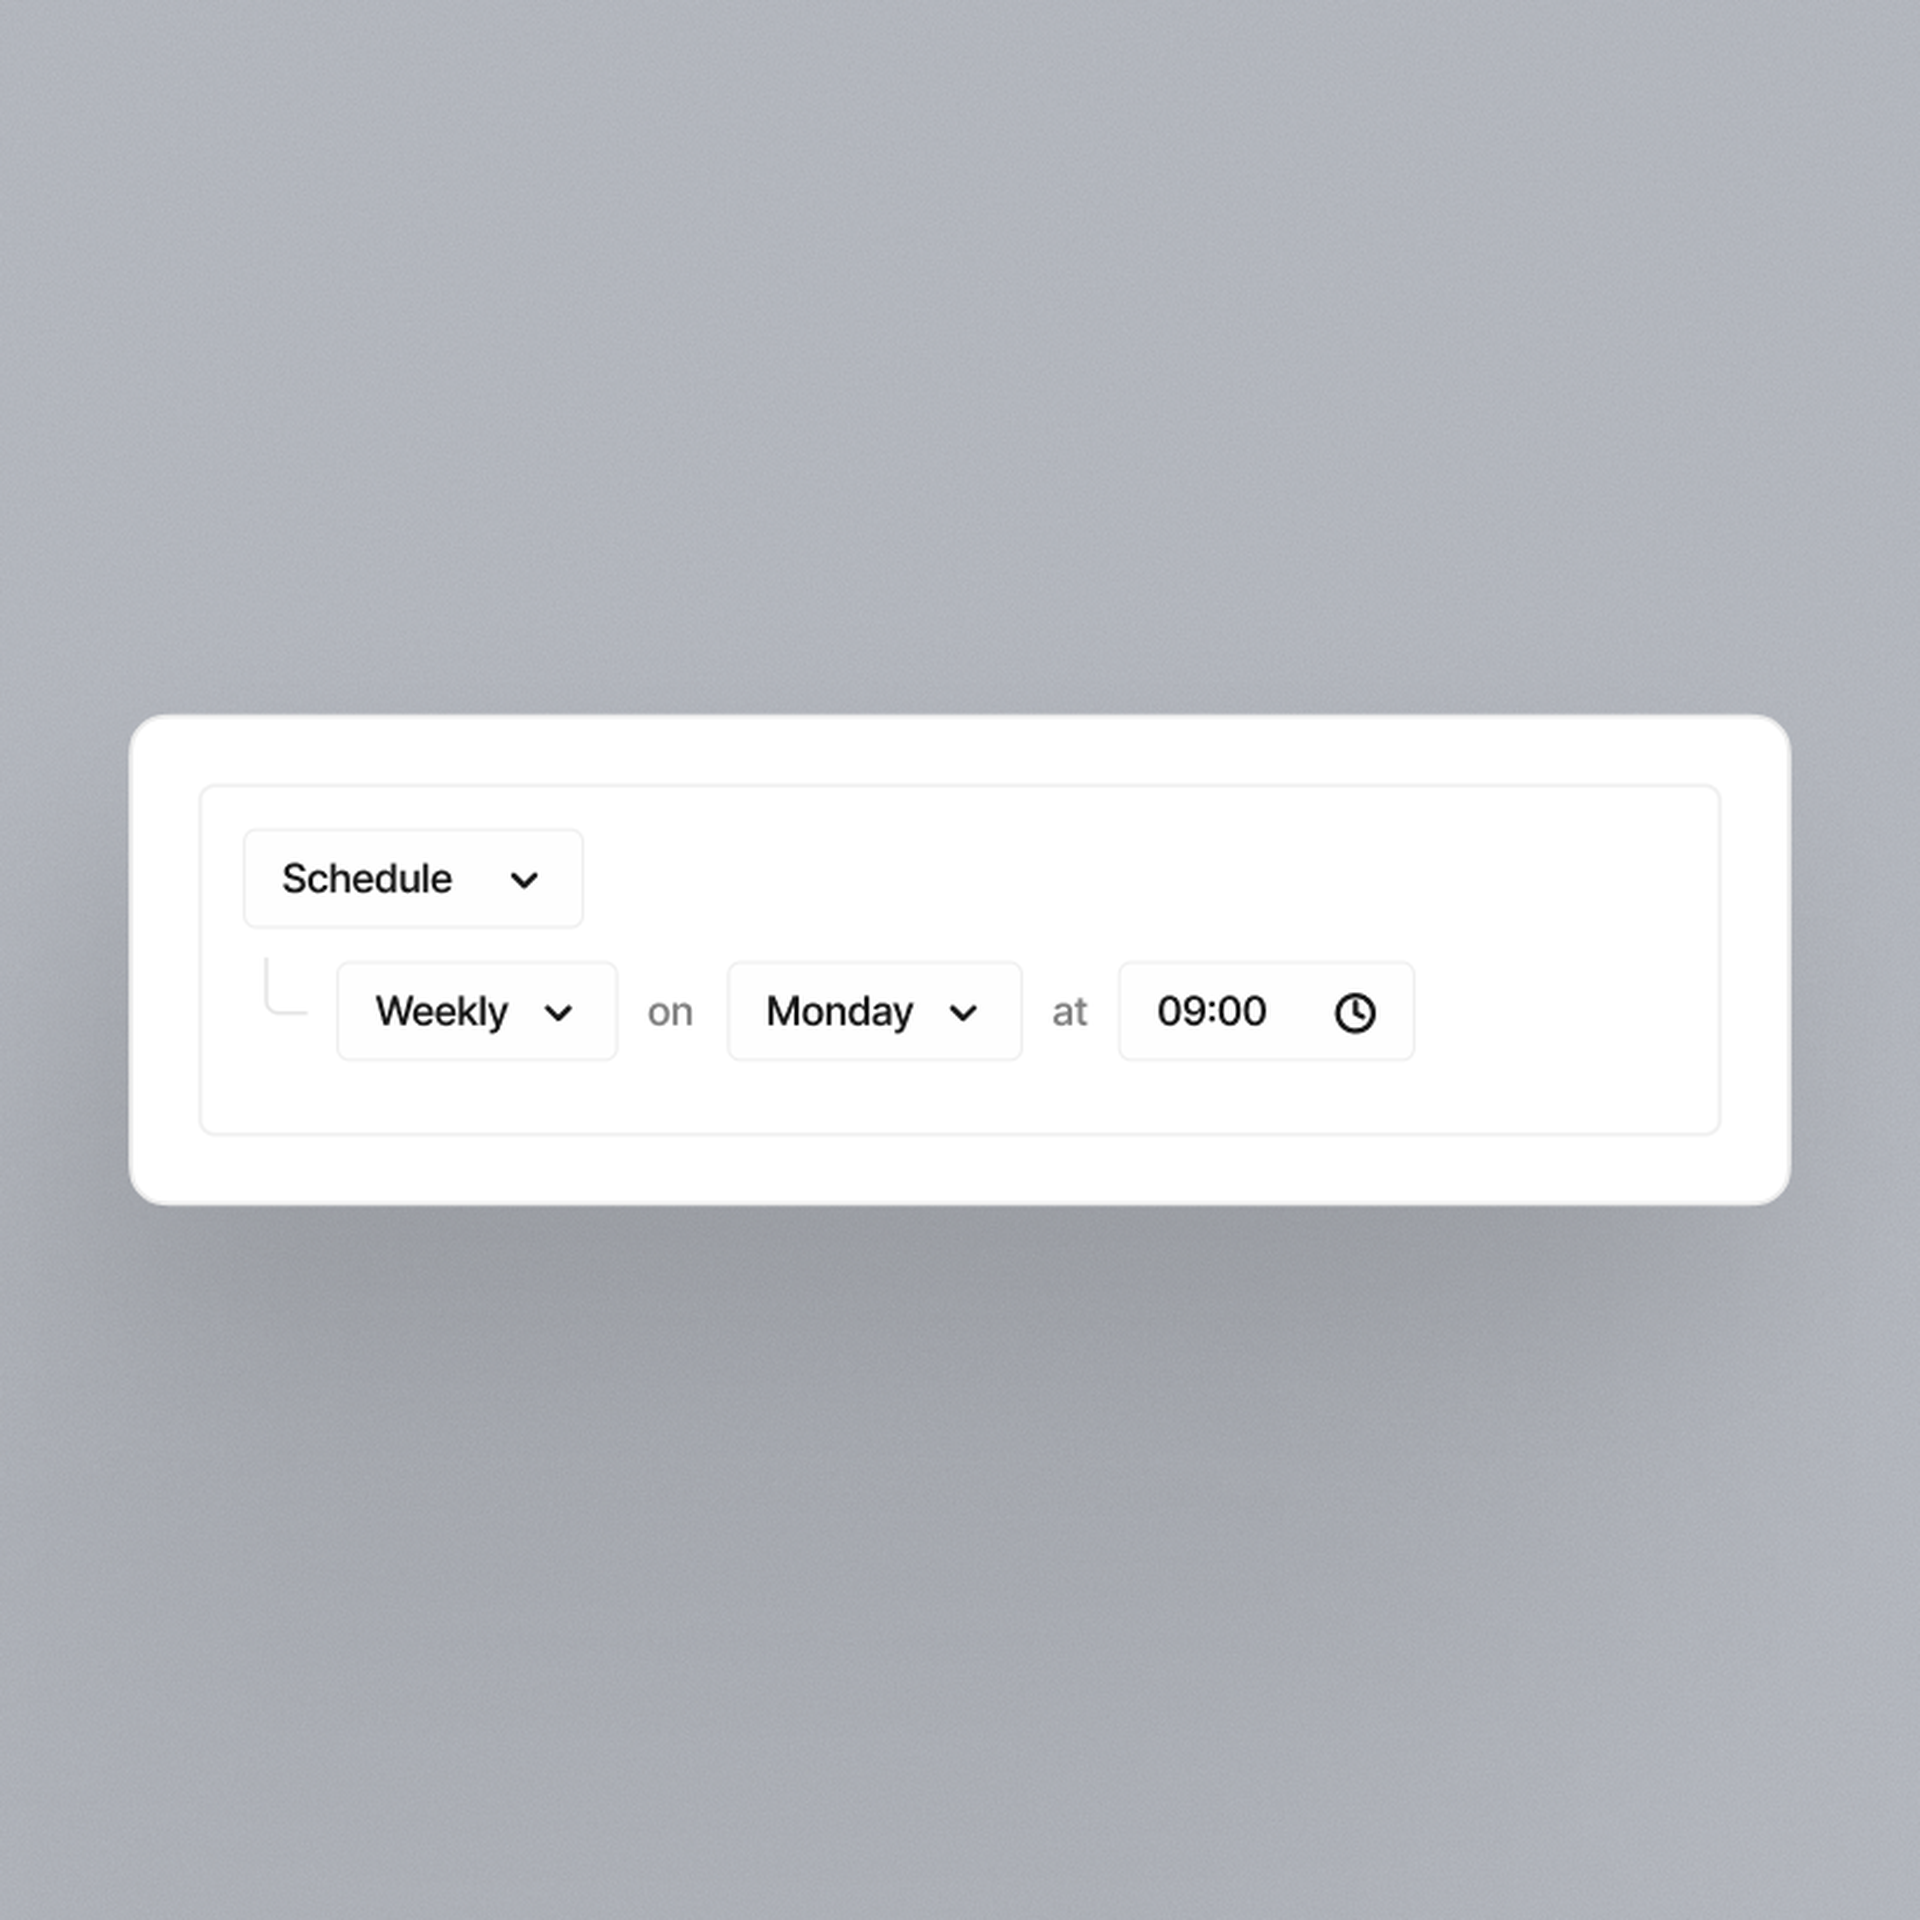
Automations
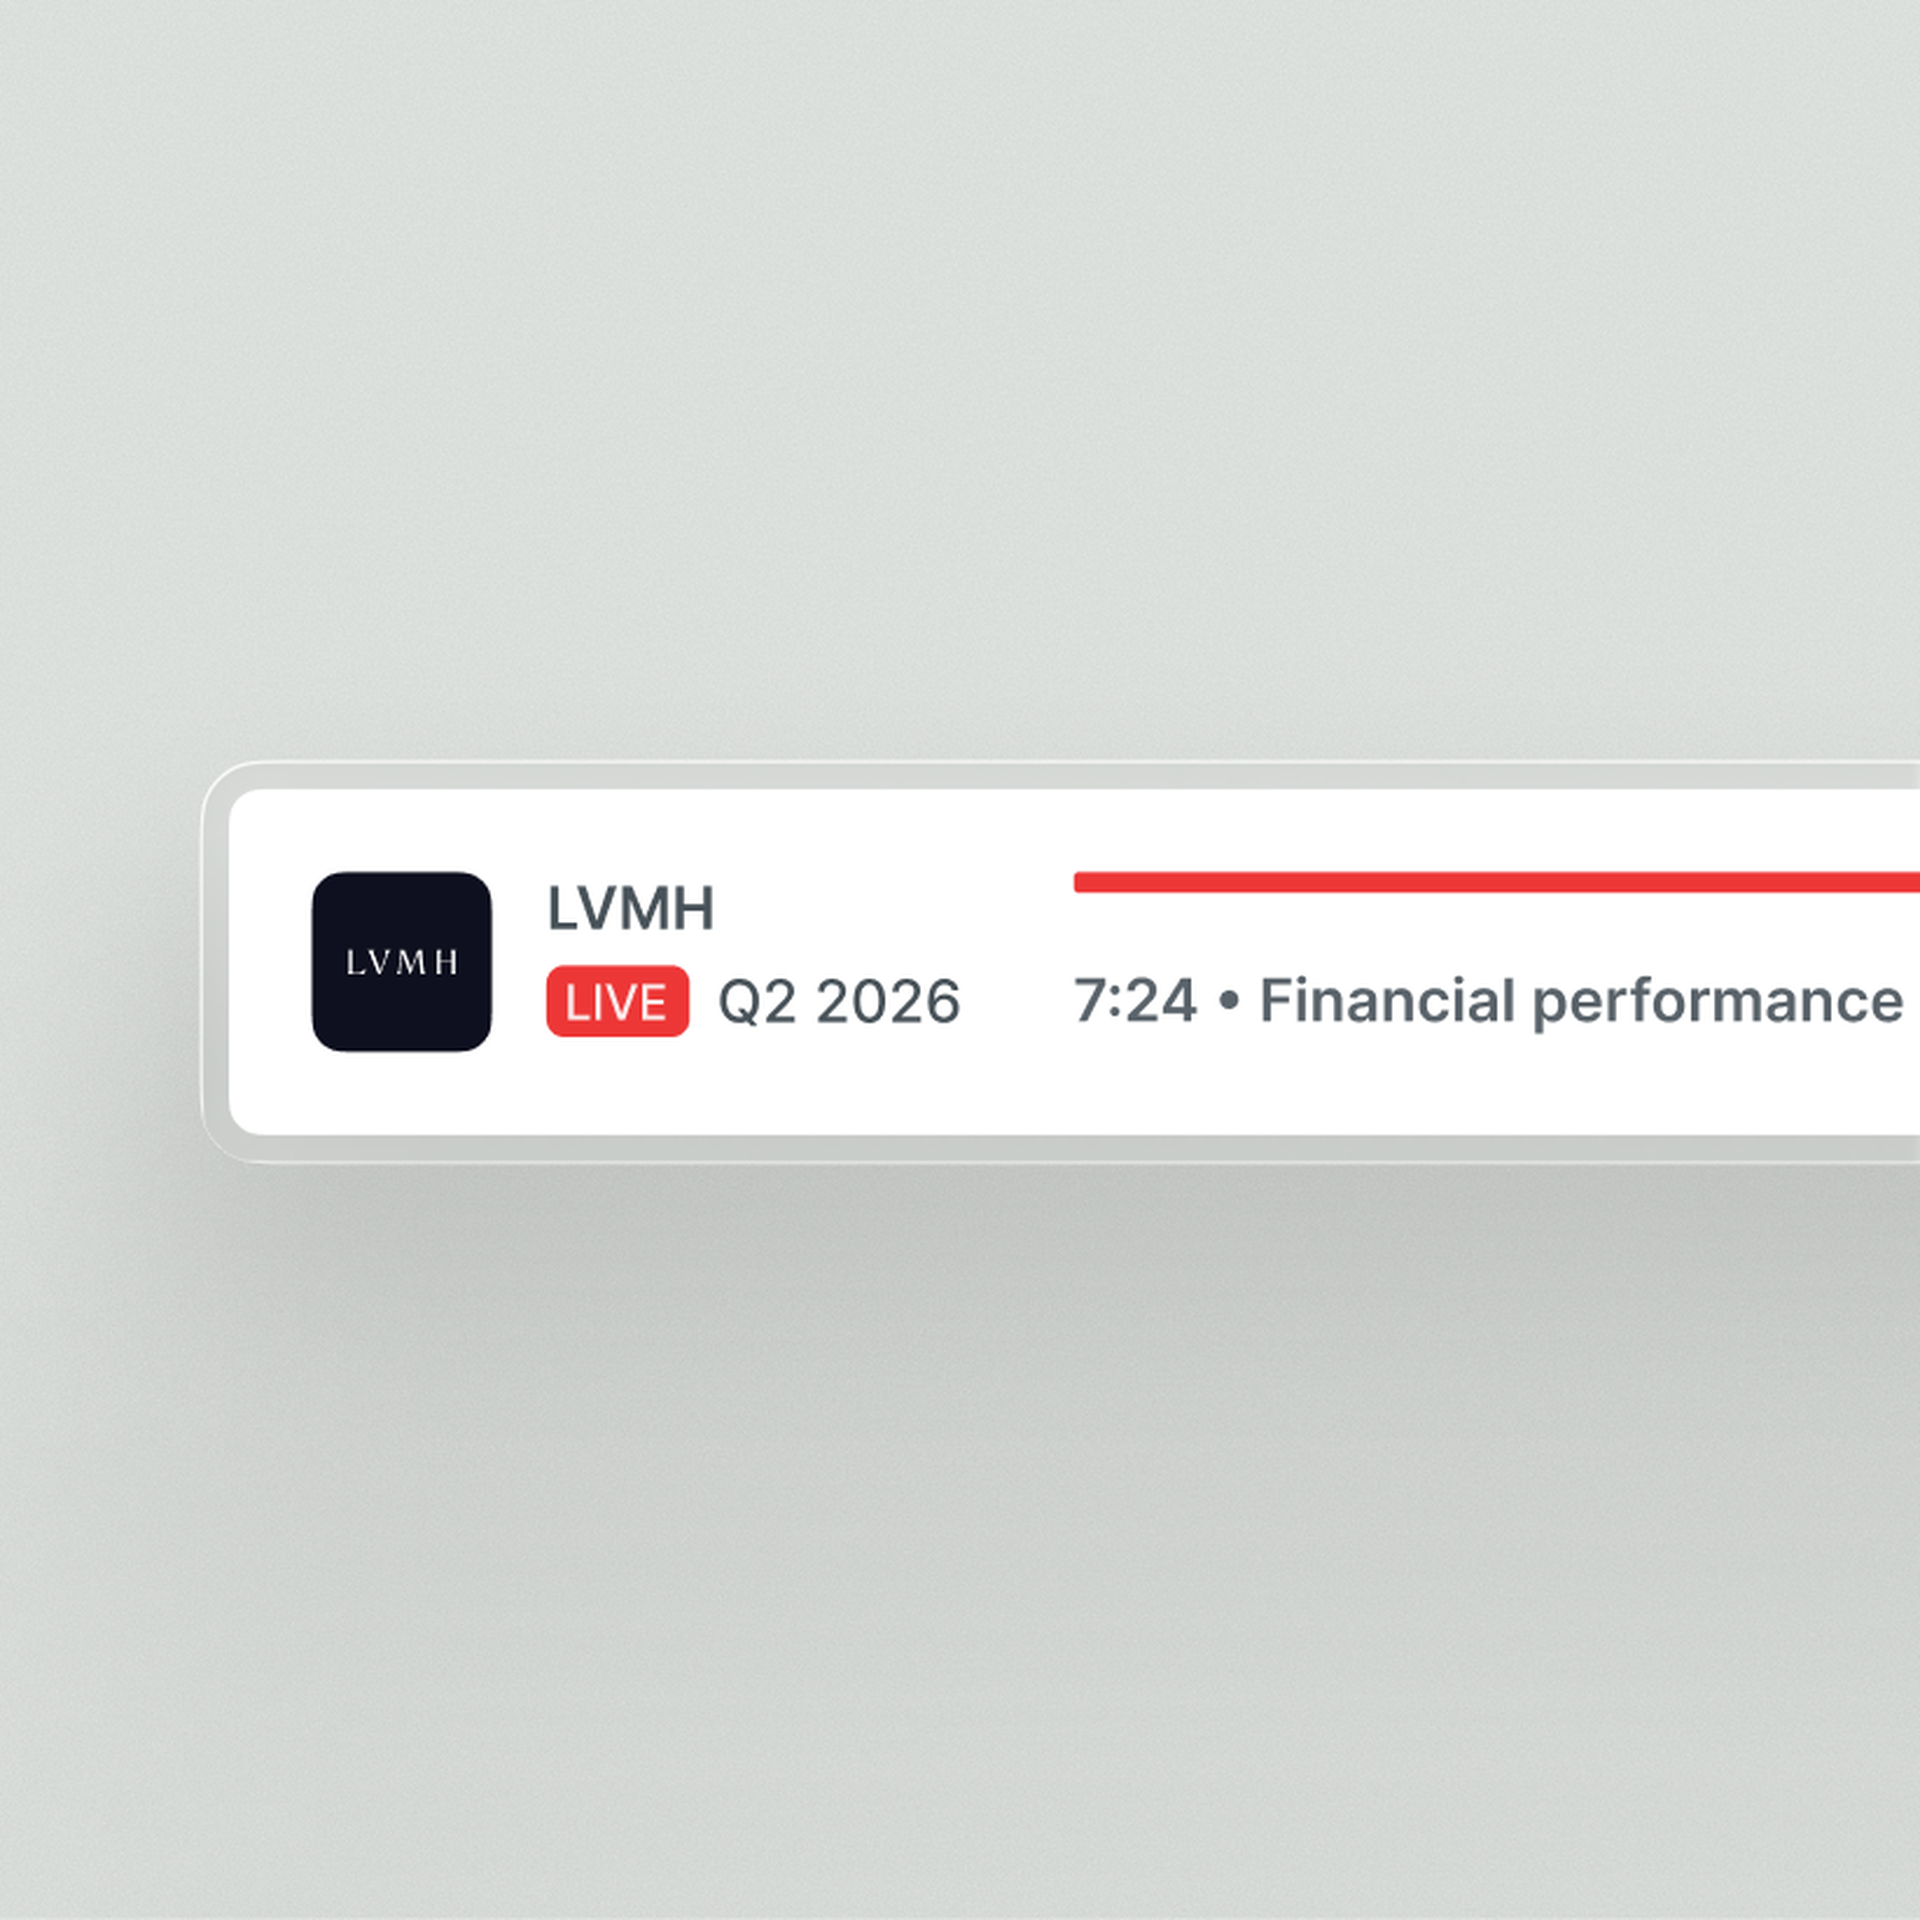
Live audio & transcripts
Quartr's AI stands out because it only pulls clean, first-party data from public companies. In investing, that's everything.
Jamie Ross
Investment Manager, GAM Investments
Research that used to take hours now takes seconds with Quartr Pro. Tracking shifts in tone or extracting tables, it's as simple as typing a query.
Tom O'Hara
Investment Director
Before Quartr we spent hours manually compiling insights through the peer earnings cycle. Now, these tasks are done faster, with greater precision.
Gregg Lampf
VP of Investor Relations
Being able to ask specific questions across years of transcripts and reports and instantly get verified answers is a game-changer.
Pontus Dackmo
CEO & Investment Manager