Edge16 Oct 2026
Winner, Winner: The Chicken McNugget Story
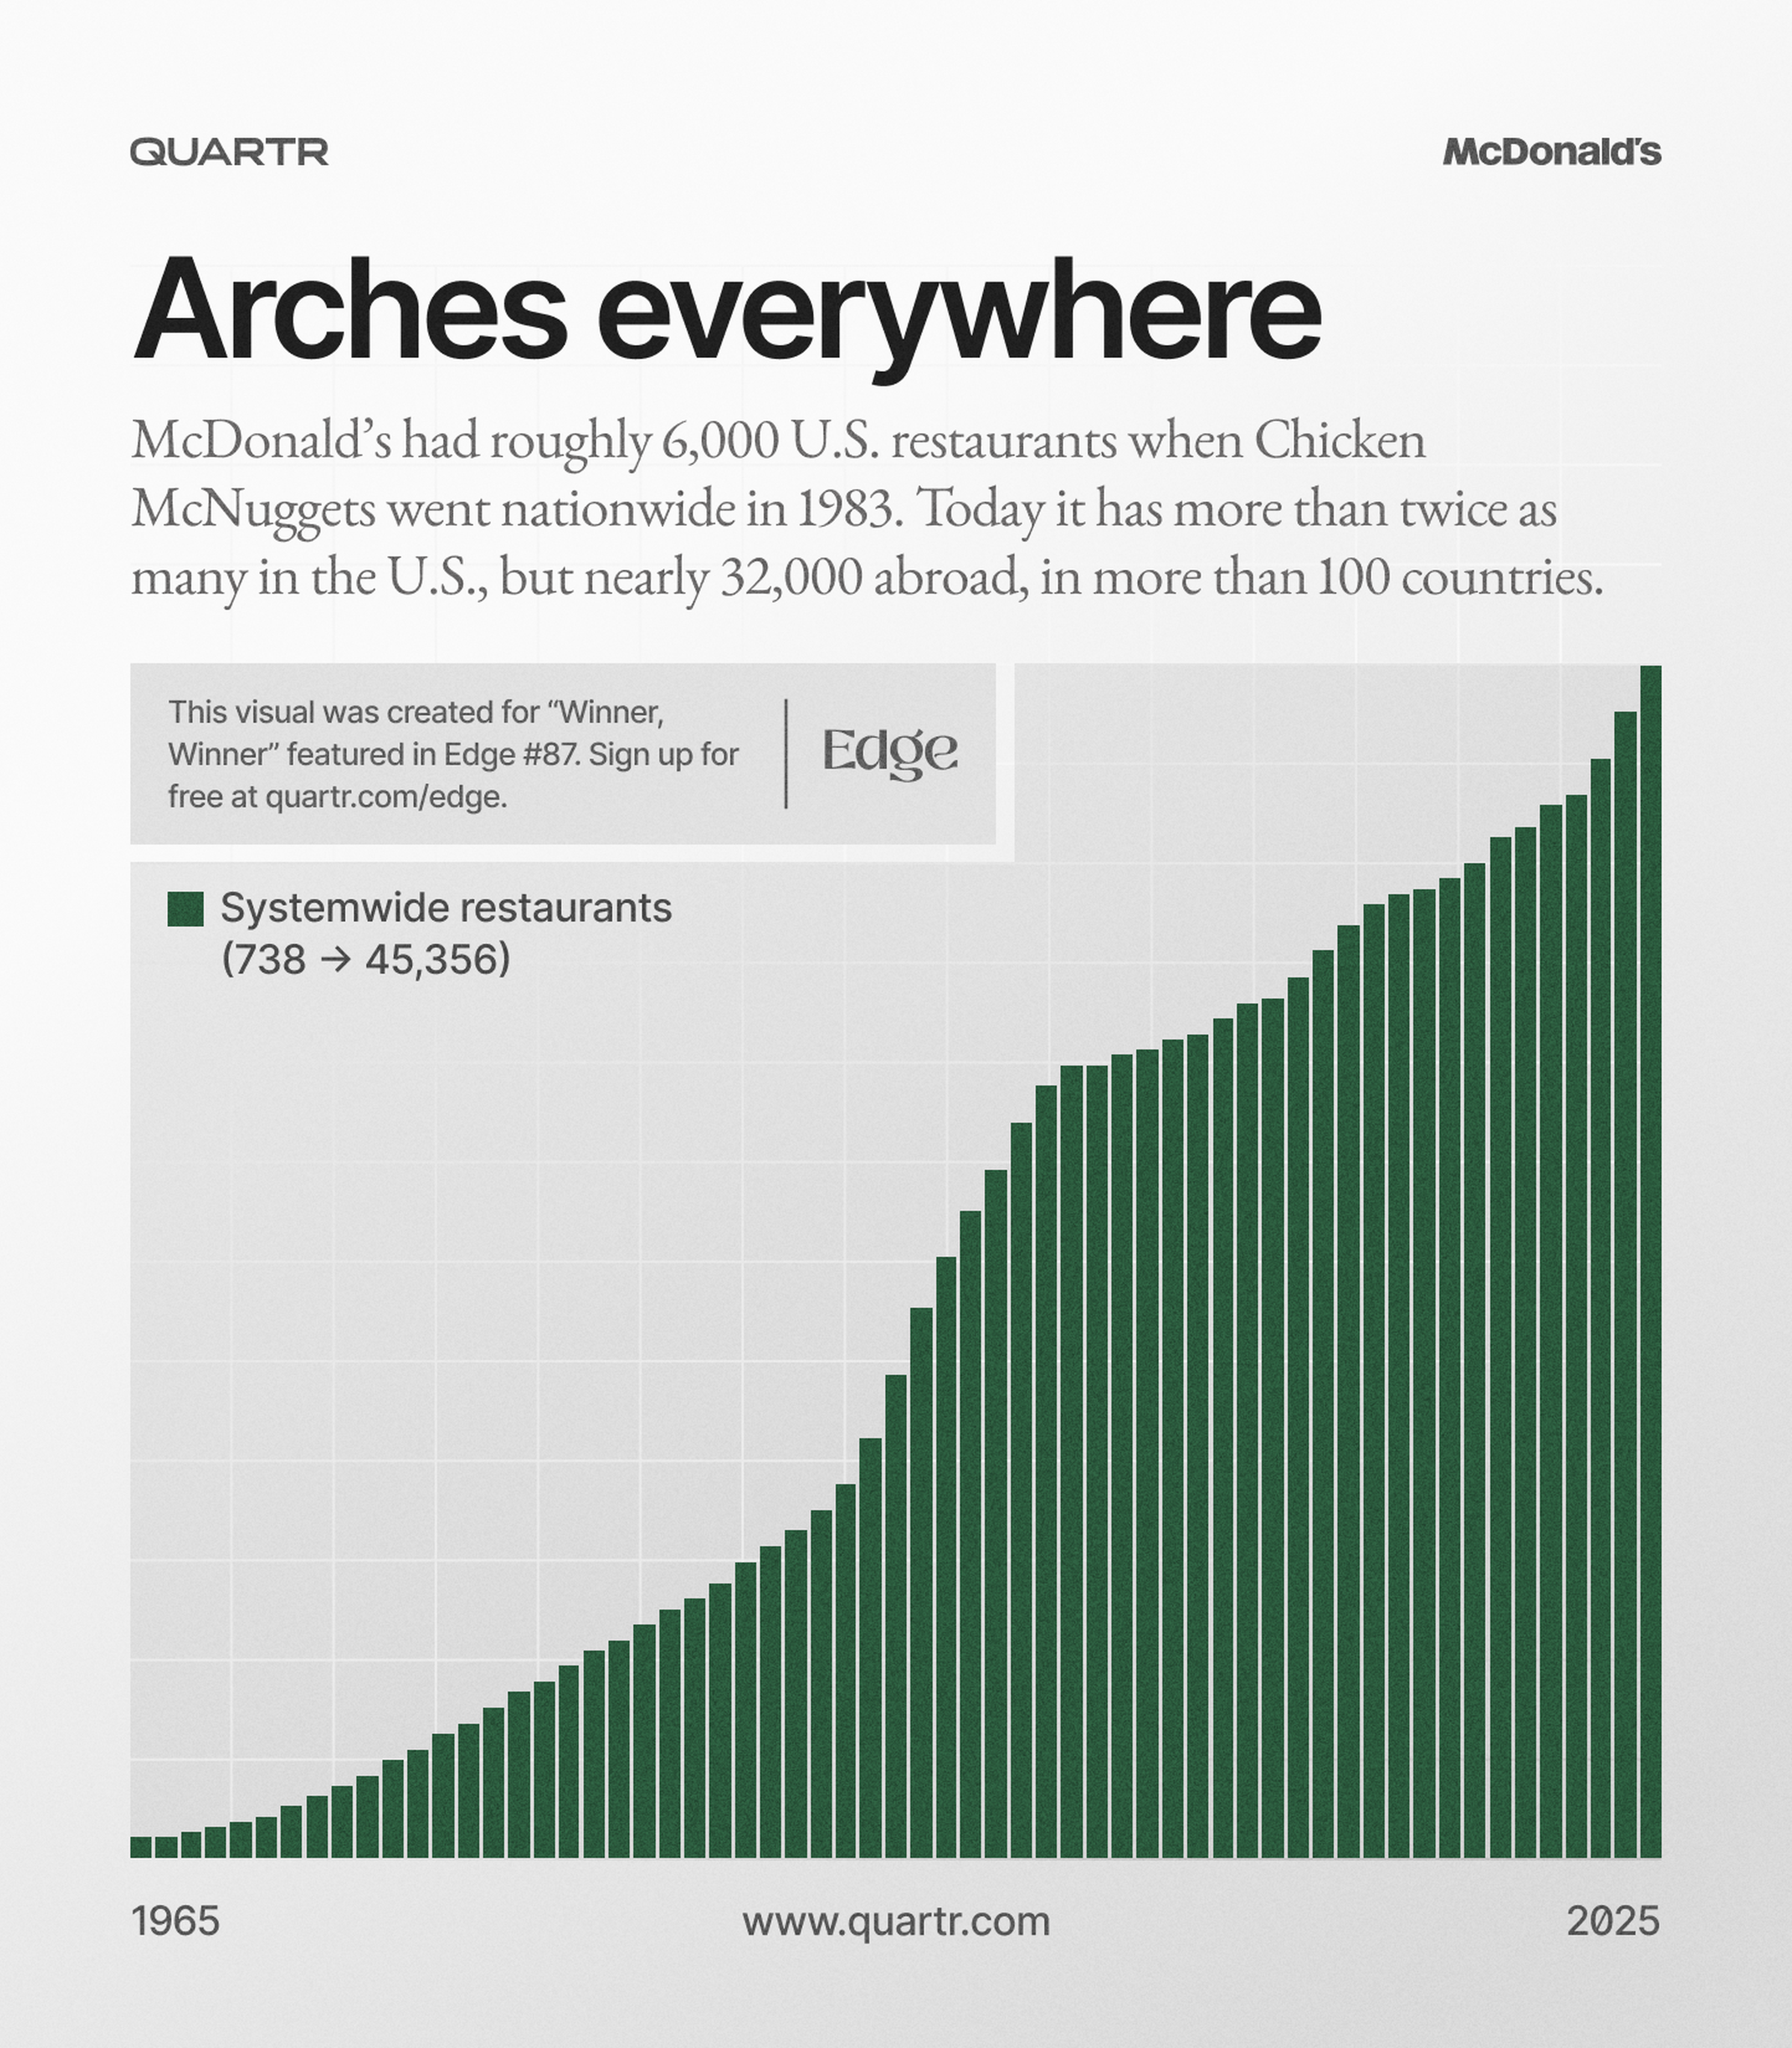
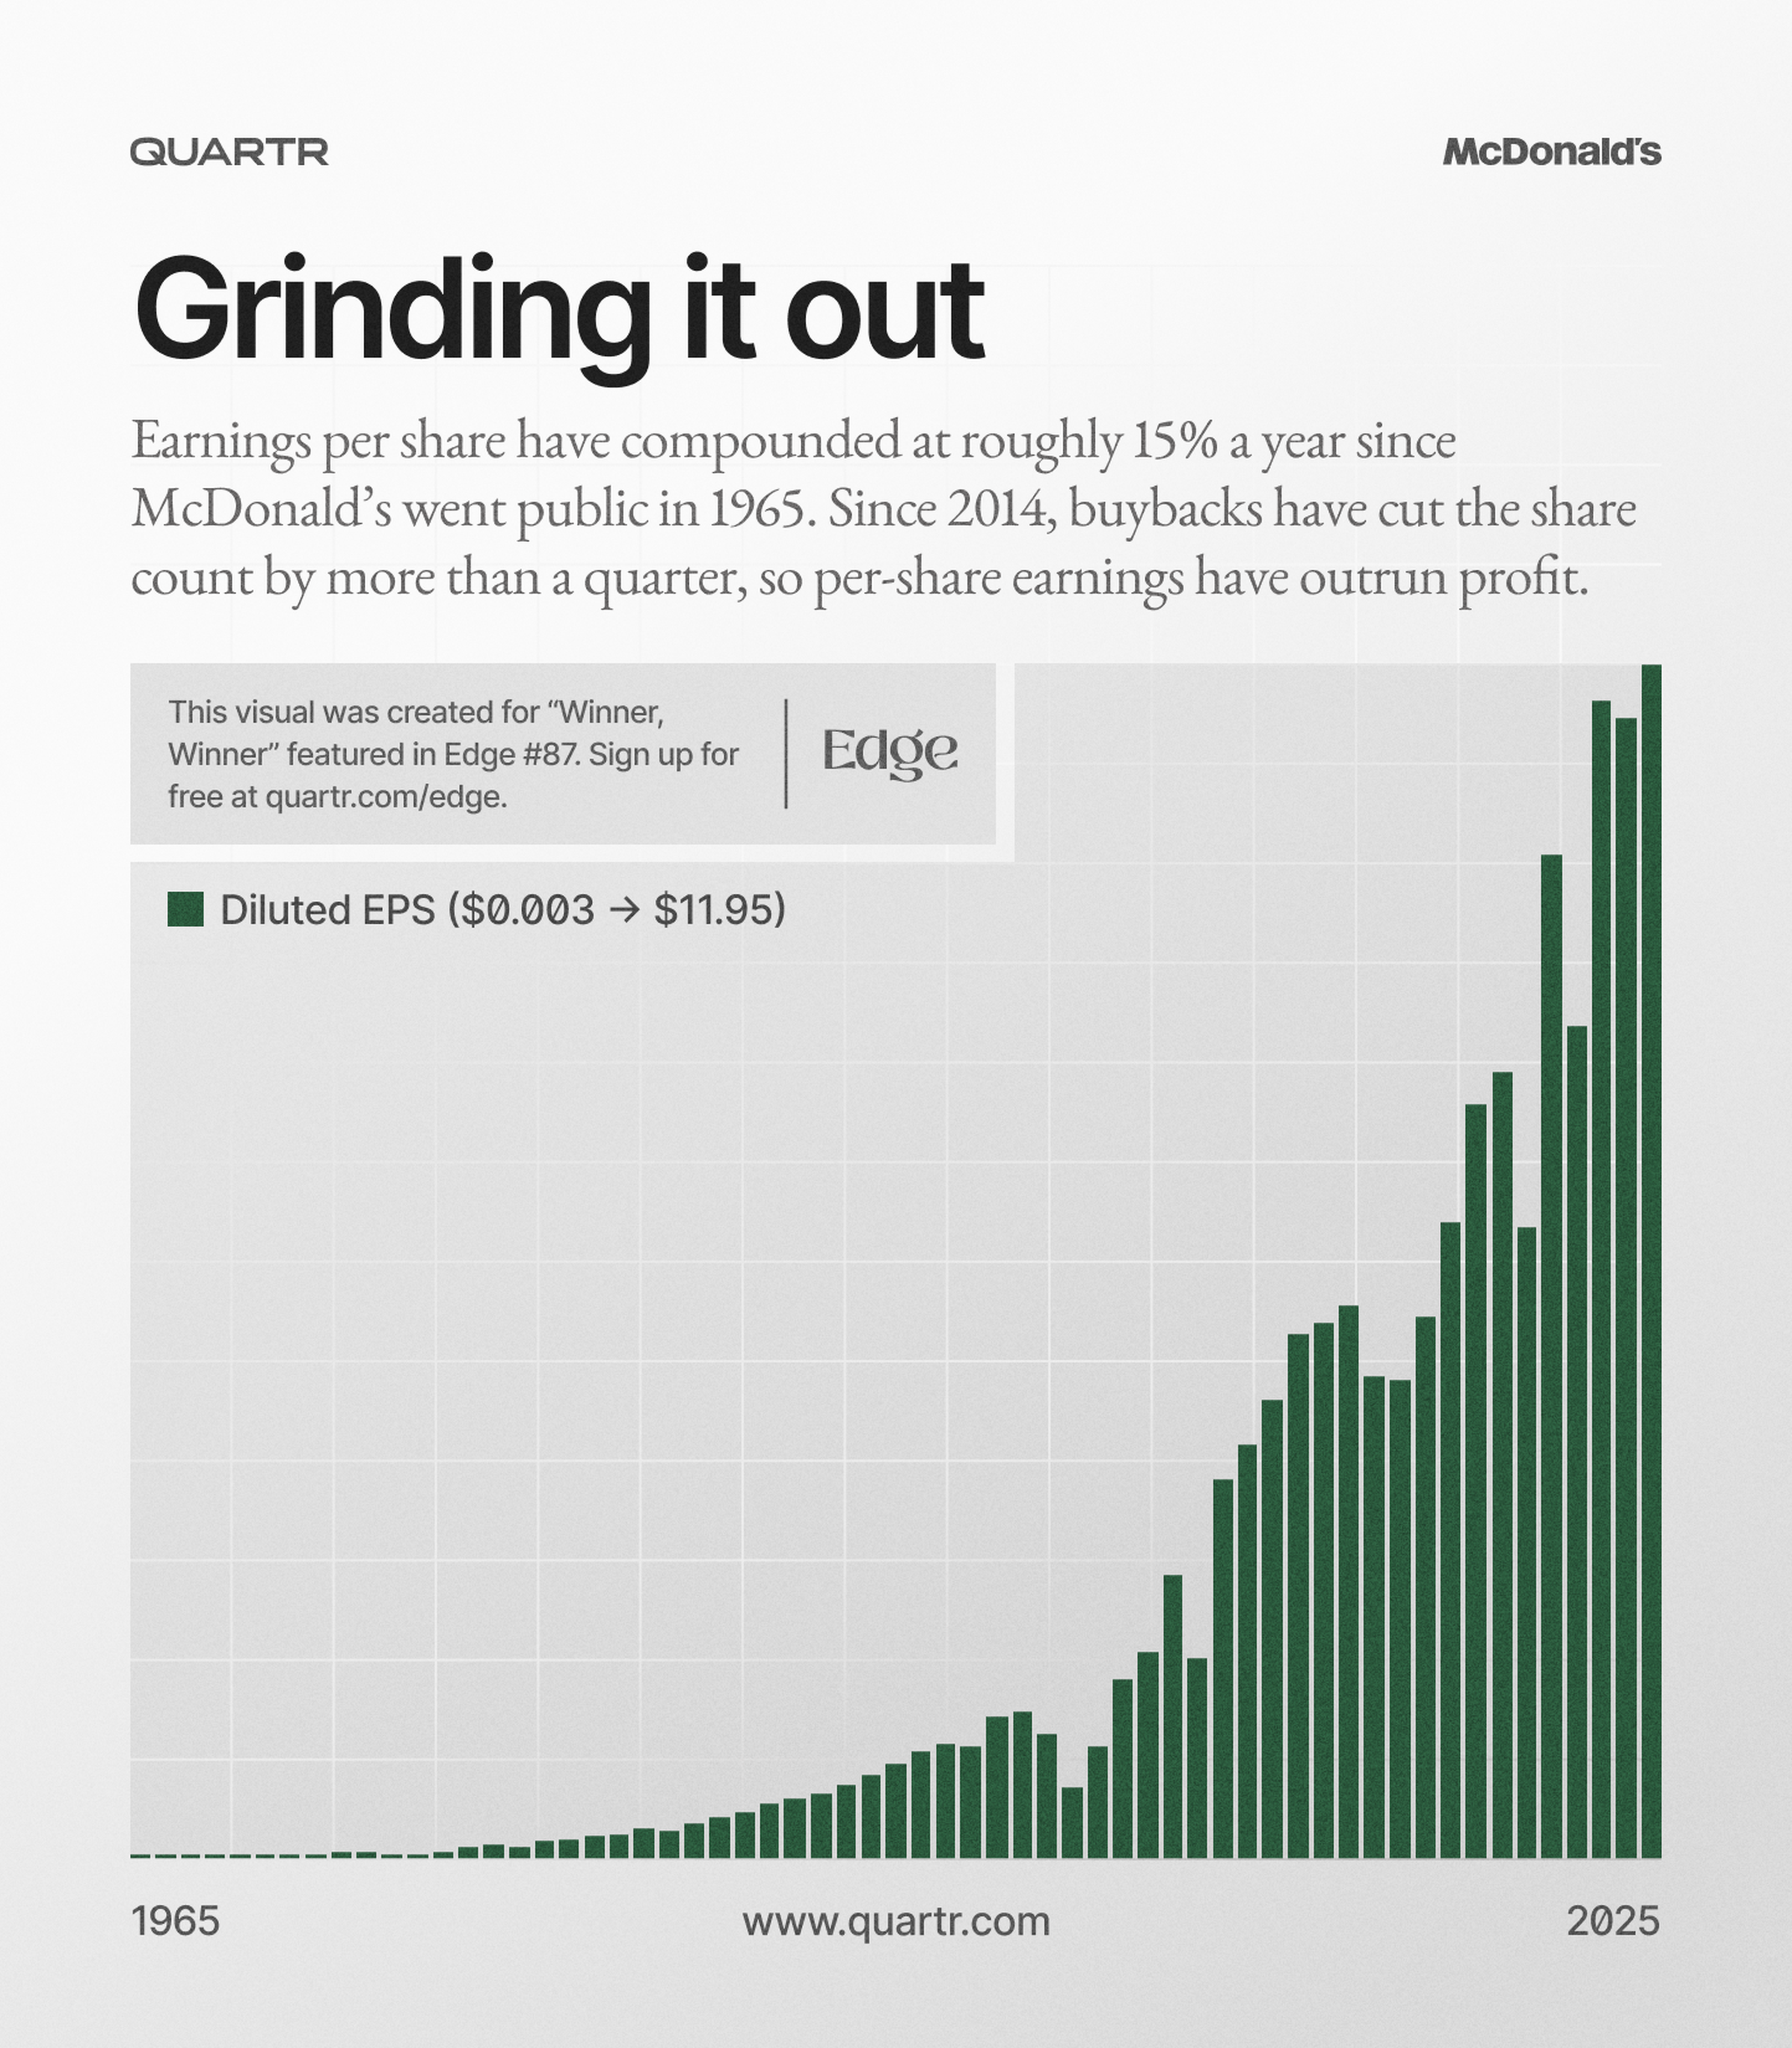
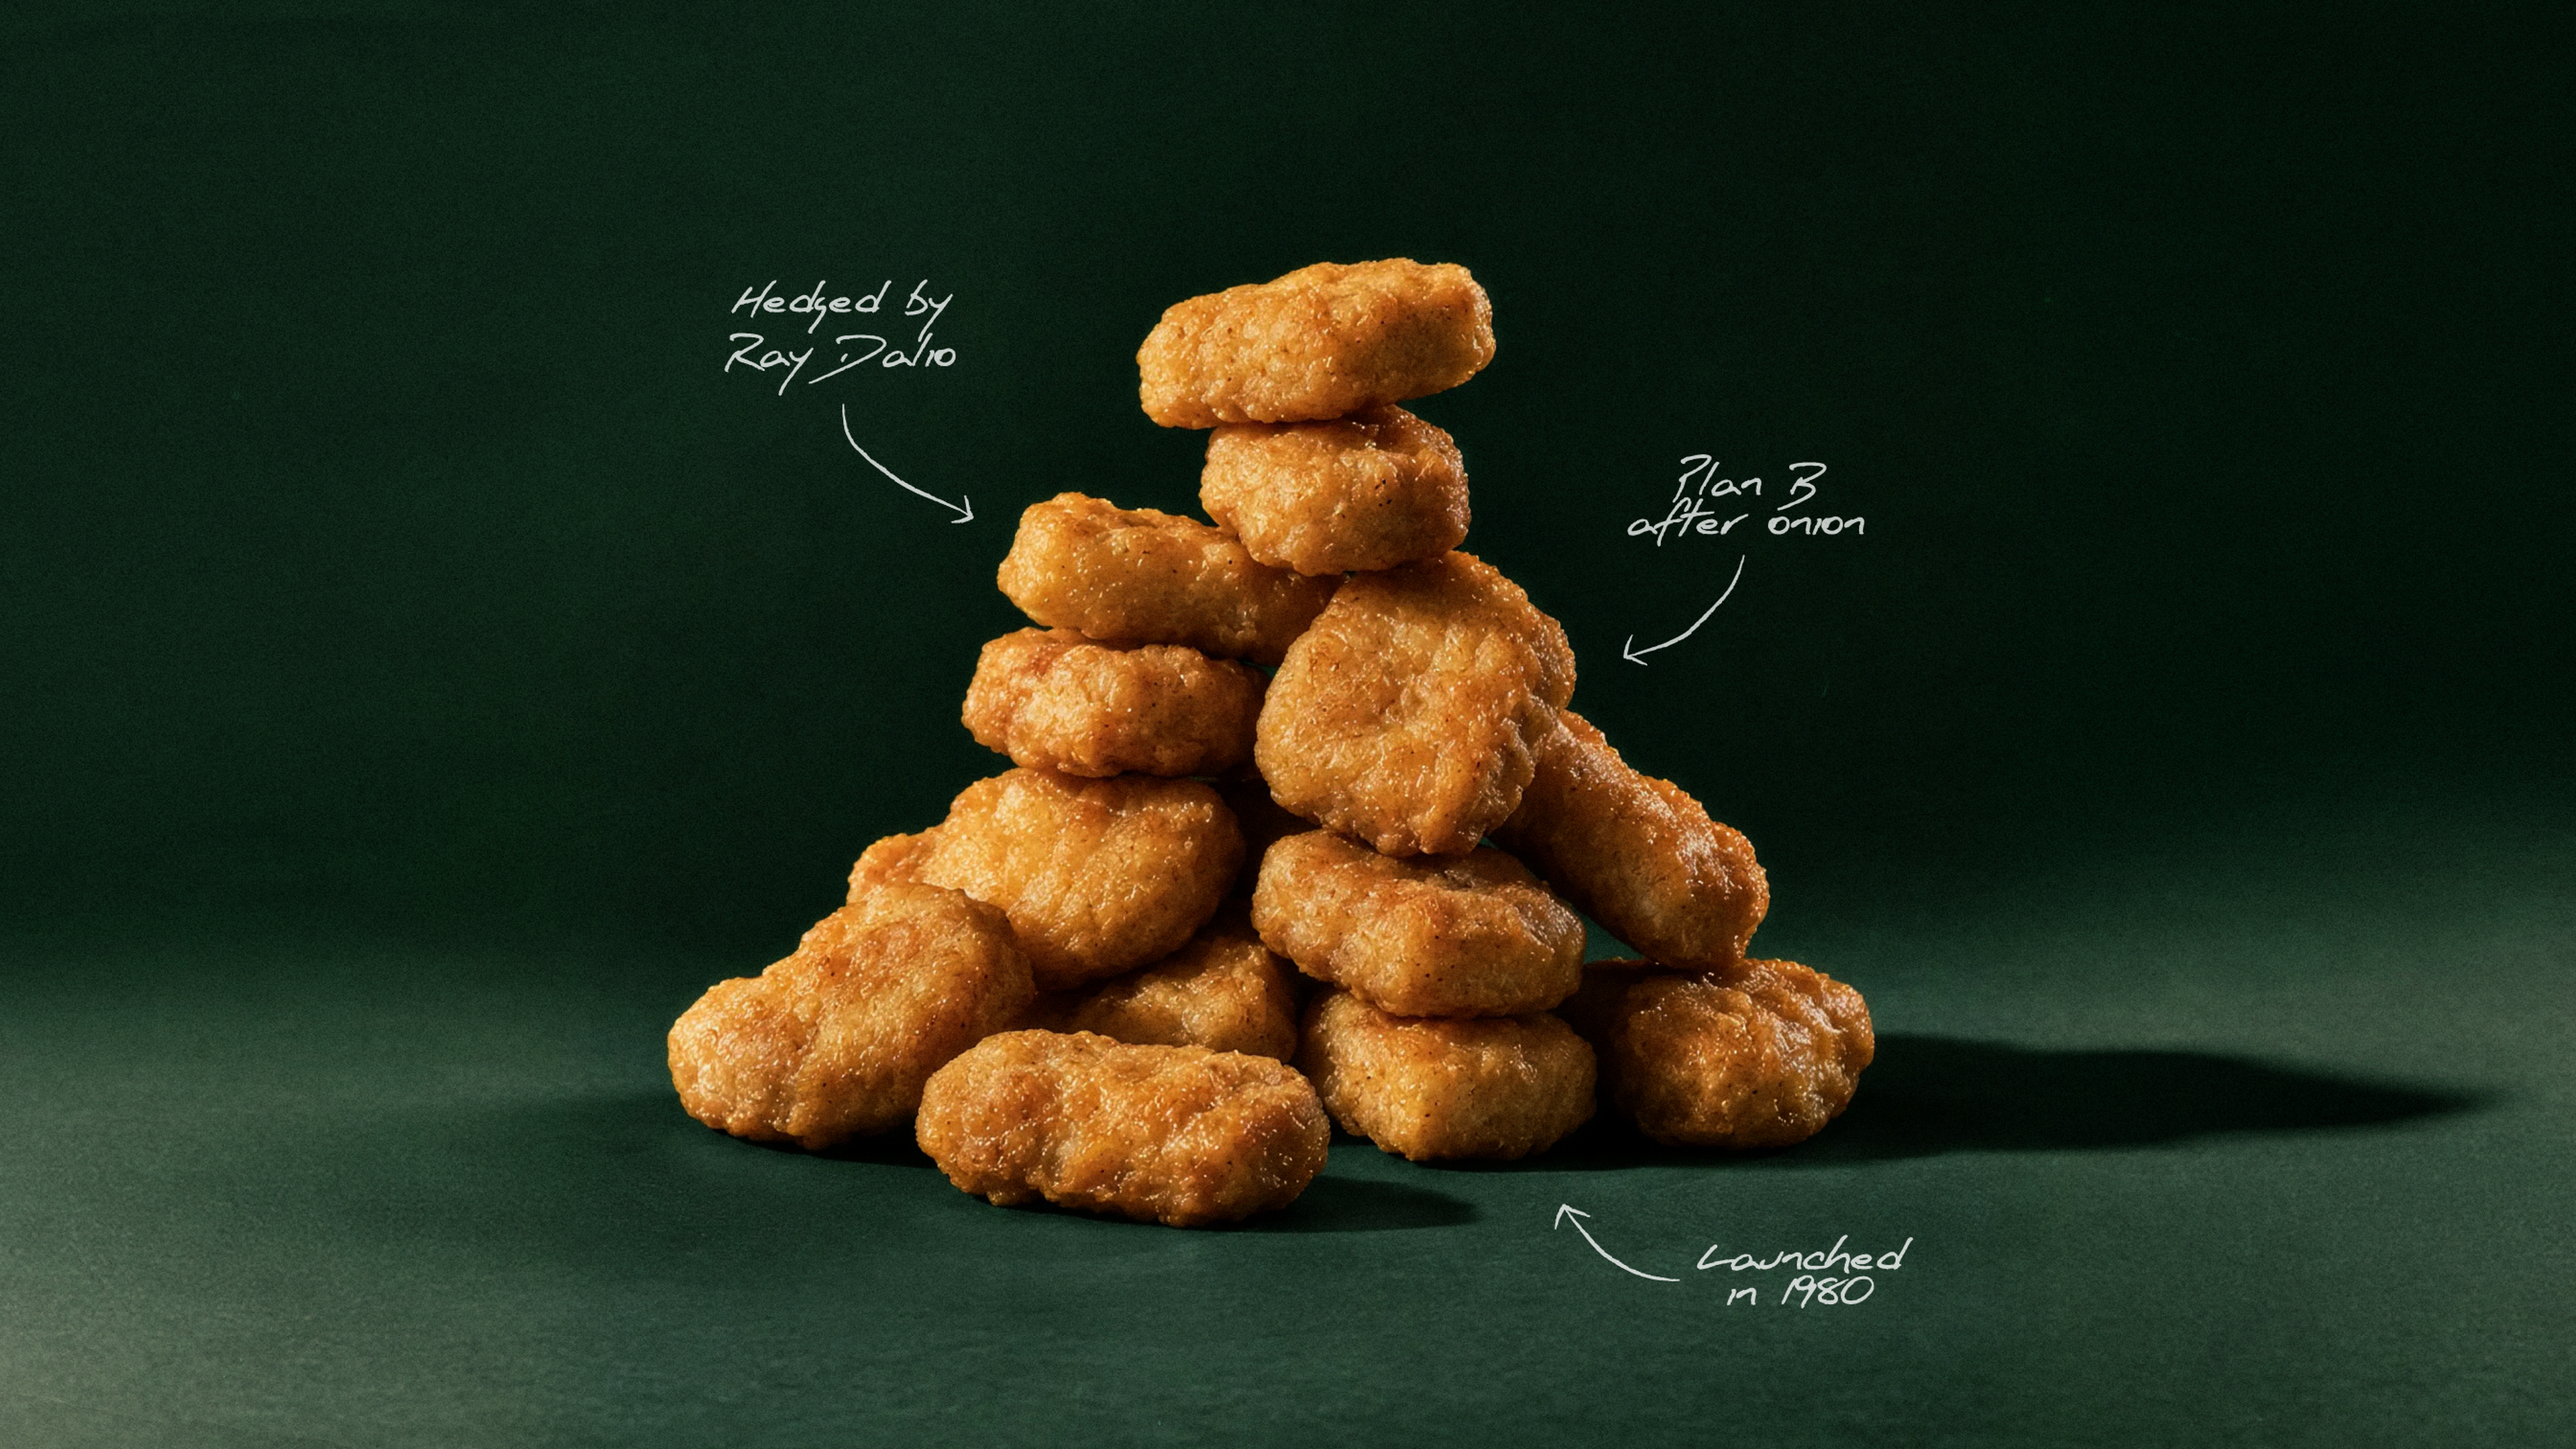
How a 1940s breeding contest, a Cornell food scientist, and a hedge by Ray Dalio helped McDonald's turn the Chicken McNugget into a fast-food icon.

Founded in 1935; operates the fourth-largest U.S. theatre exhibitor and an 18-property hotel portfolio; LTM revenue $817.4M, adjusted EBITDA $124.7M and margin 16.1%; market cap ~$829.5M as of Nov. 2, 2026.
Theatres contributed 37% of LTM revenue, 79% of operating income and 69% of adjusted EBITDA; hotels contributed 63%, 21% and 31%, respectively.
Theatre footprint: 975 screens across 77 locations in 17 states; hotel platform: 18 managed properties, 4,800+ rooms, 40+ food and beverage outlets and 400,000+ sq. ft. of meeting and event space.
Owns 62% of movie theatres and eight hotels; real estate ownership reduces fixed lease payments, supports credit and creates potential monetization opportunities.
Invested $581M in assets over the past decade through fiscal 2025, including $340M in theatres and $241M in hotels and resorts.
Q3 2026 delivered record revenue and operating income; theatres outperformed the industry by 1.3 percentage points YTD Q3 2026.
Theatres’ 9M 2026 revenue was $386.0M, operating income $46.0M and adjusted EBITDA $76.7M; respective YoY changes were +14.7%, +111.6% and +46.5%.
Same-store theatre admission revenue rose 16.7% YTD Q3 2026, or 21.3% on a comparable-calendar basis; average ticket price rose 5.6% and concession revenue per person 2.9% YoY.
Hotels’ 9M 2026 revenue was $204.4M, operating income $14.1M and adjusted EBITDA $37.0M; respective YoY changes were +3.7%, -2.7% and +4.6%.
Comparable owned-hotel RevPAR grew 9.3% YTD Q3 2026; performance exceeded the industry by 3.5 percentage points and competitive sets by 8.1 points.
Theatre investments include recliner seating in 87% of owned theatres and 89% of screens; 126 premium large-format screens, with PLF available in 84% of owned theatres.
Expanded food and beverage is available in 70% of theatres; 96% offer beer and wine or canned alcoholic beverages, and 63% offer full liquor through bars and lounges.
77% of Americans aged 12–74 saw at least one theatre movie in 2025; habitual moviegoers grew 8%, averaging 6.1 annual visits.
Growth priorities include loyalty insights, pricing, lobby and digital monetization, theatre upgrades, frictionless purchasing, new viewing formats and acquisitions, new builds or management contracts.
A broad slate of franchise films is highlighted for the remainder of 2026 and 2027, with the slate subject to change.

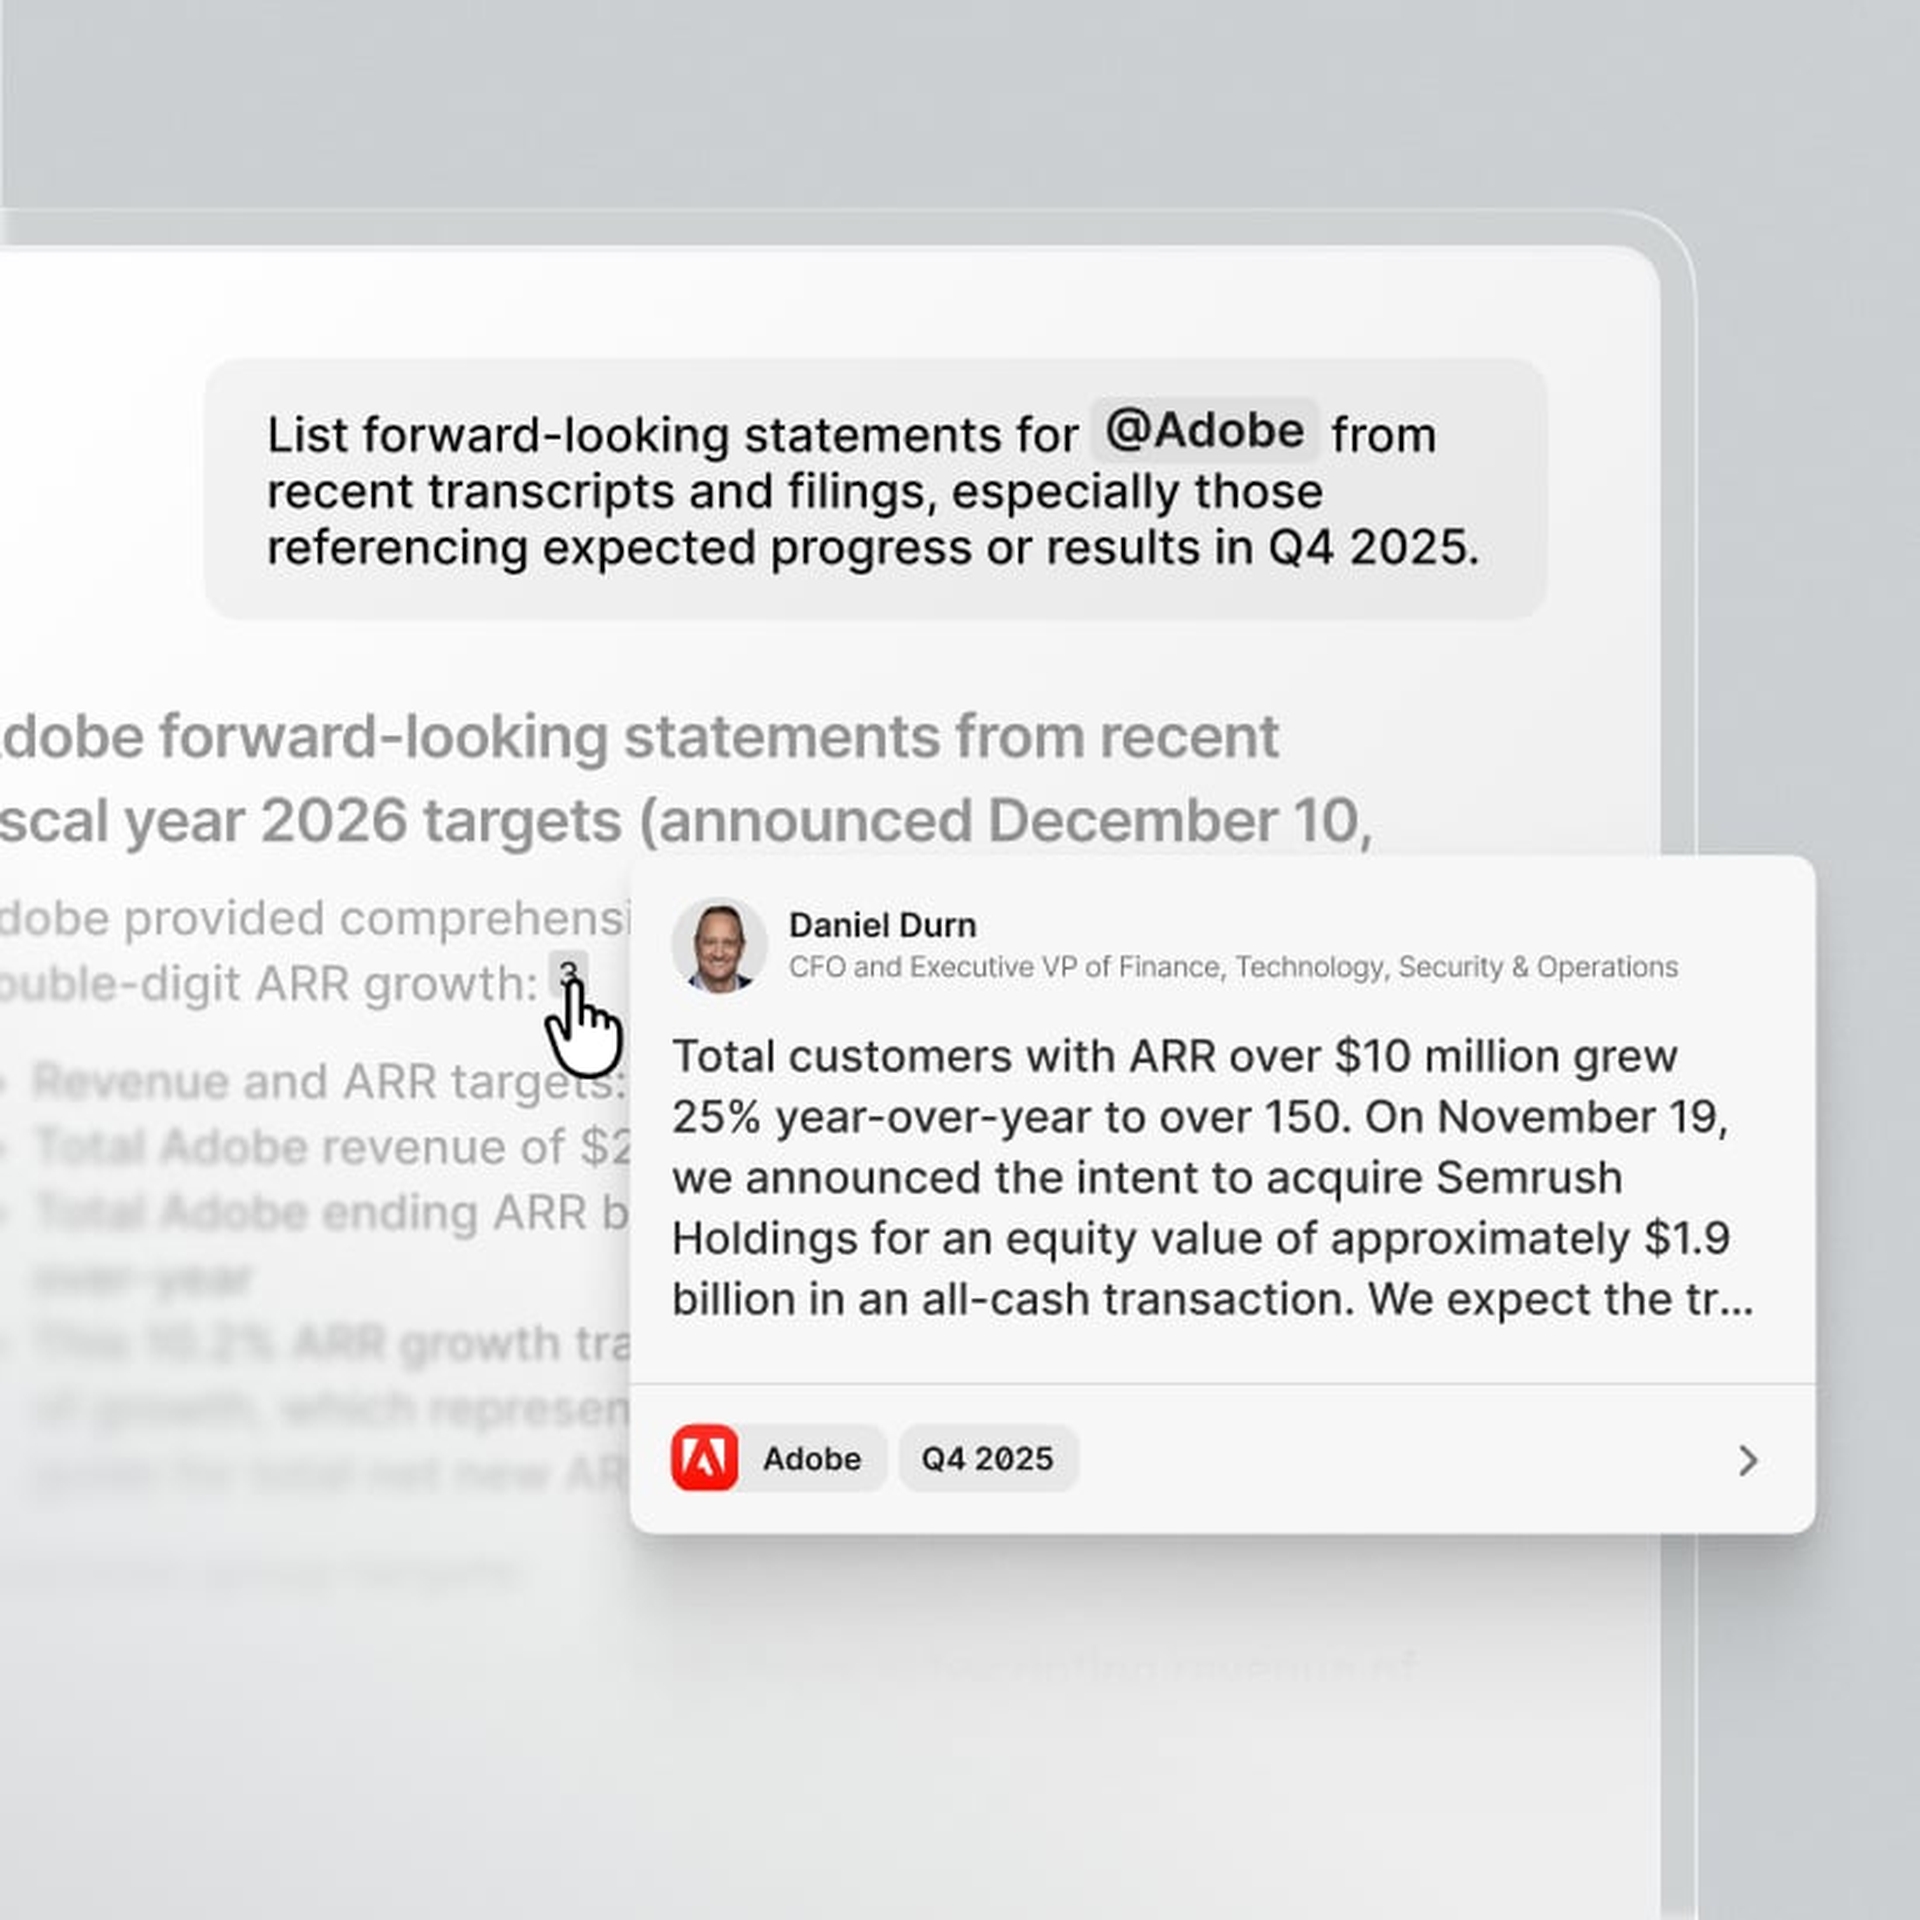
AI chat
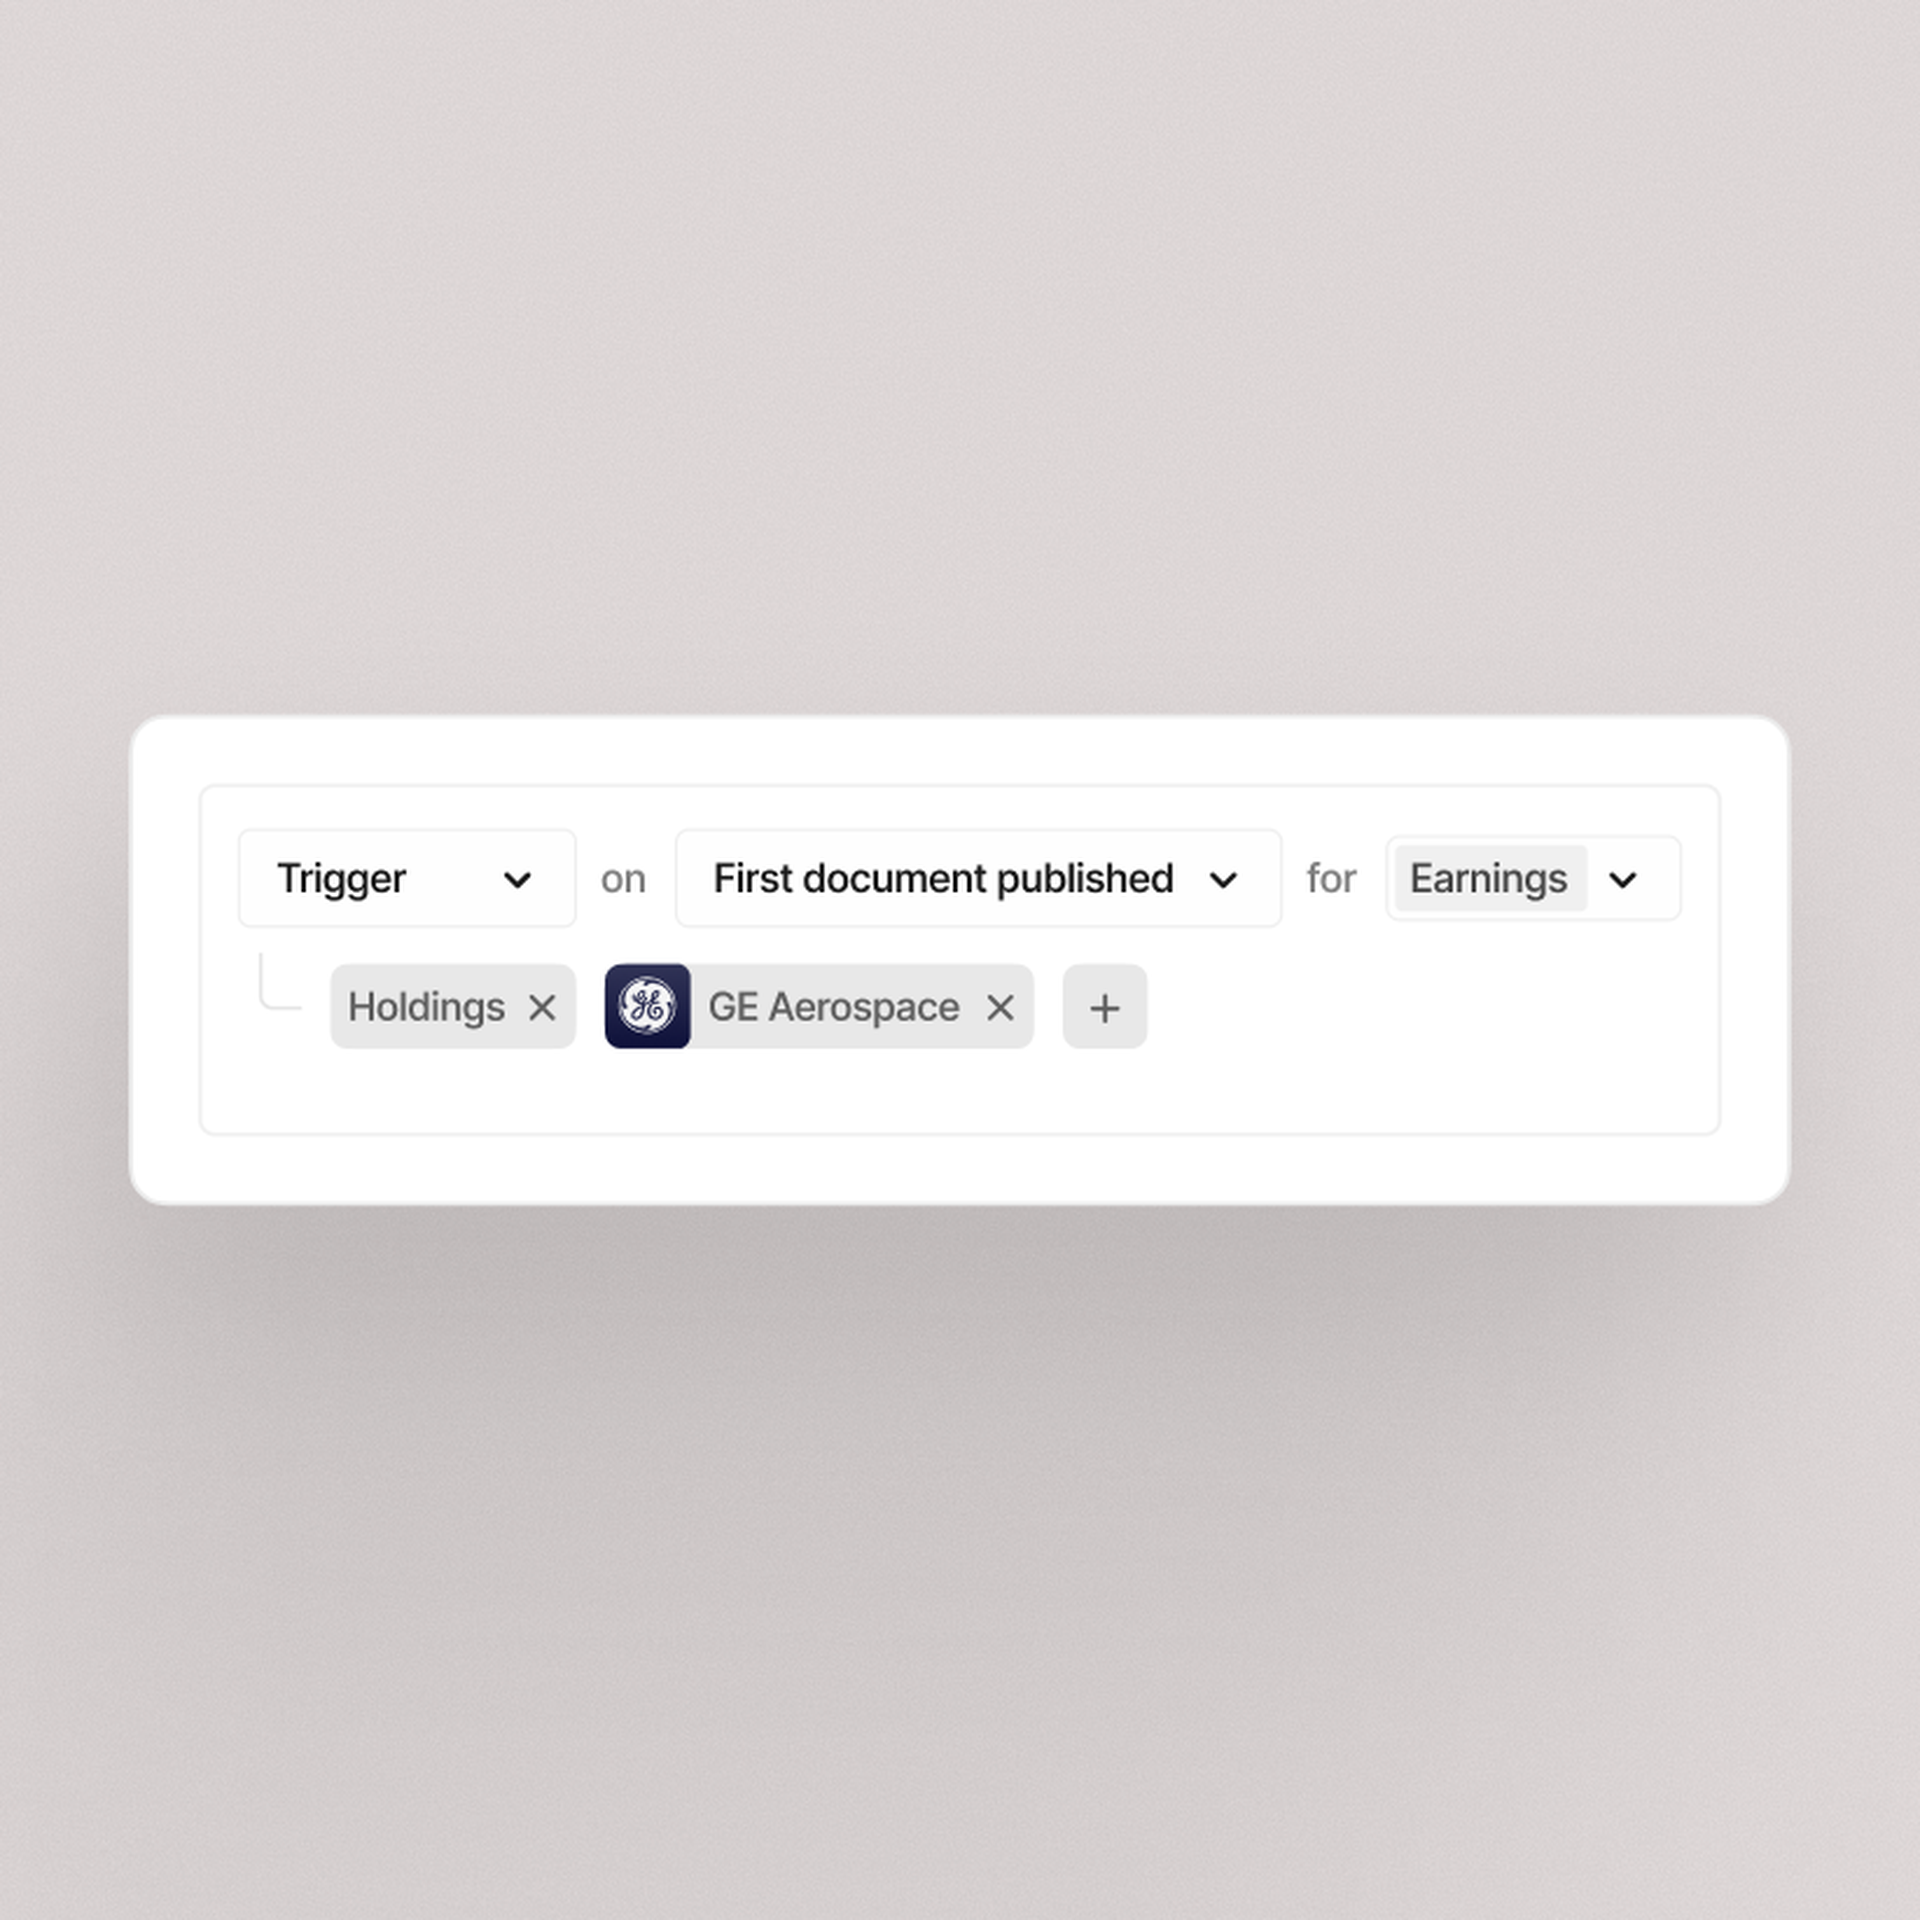
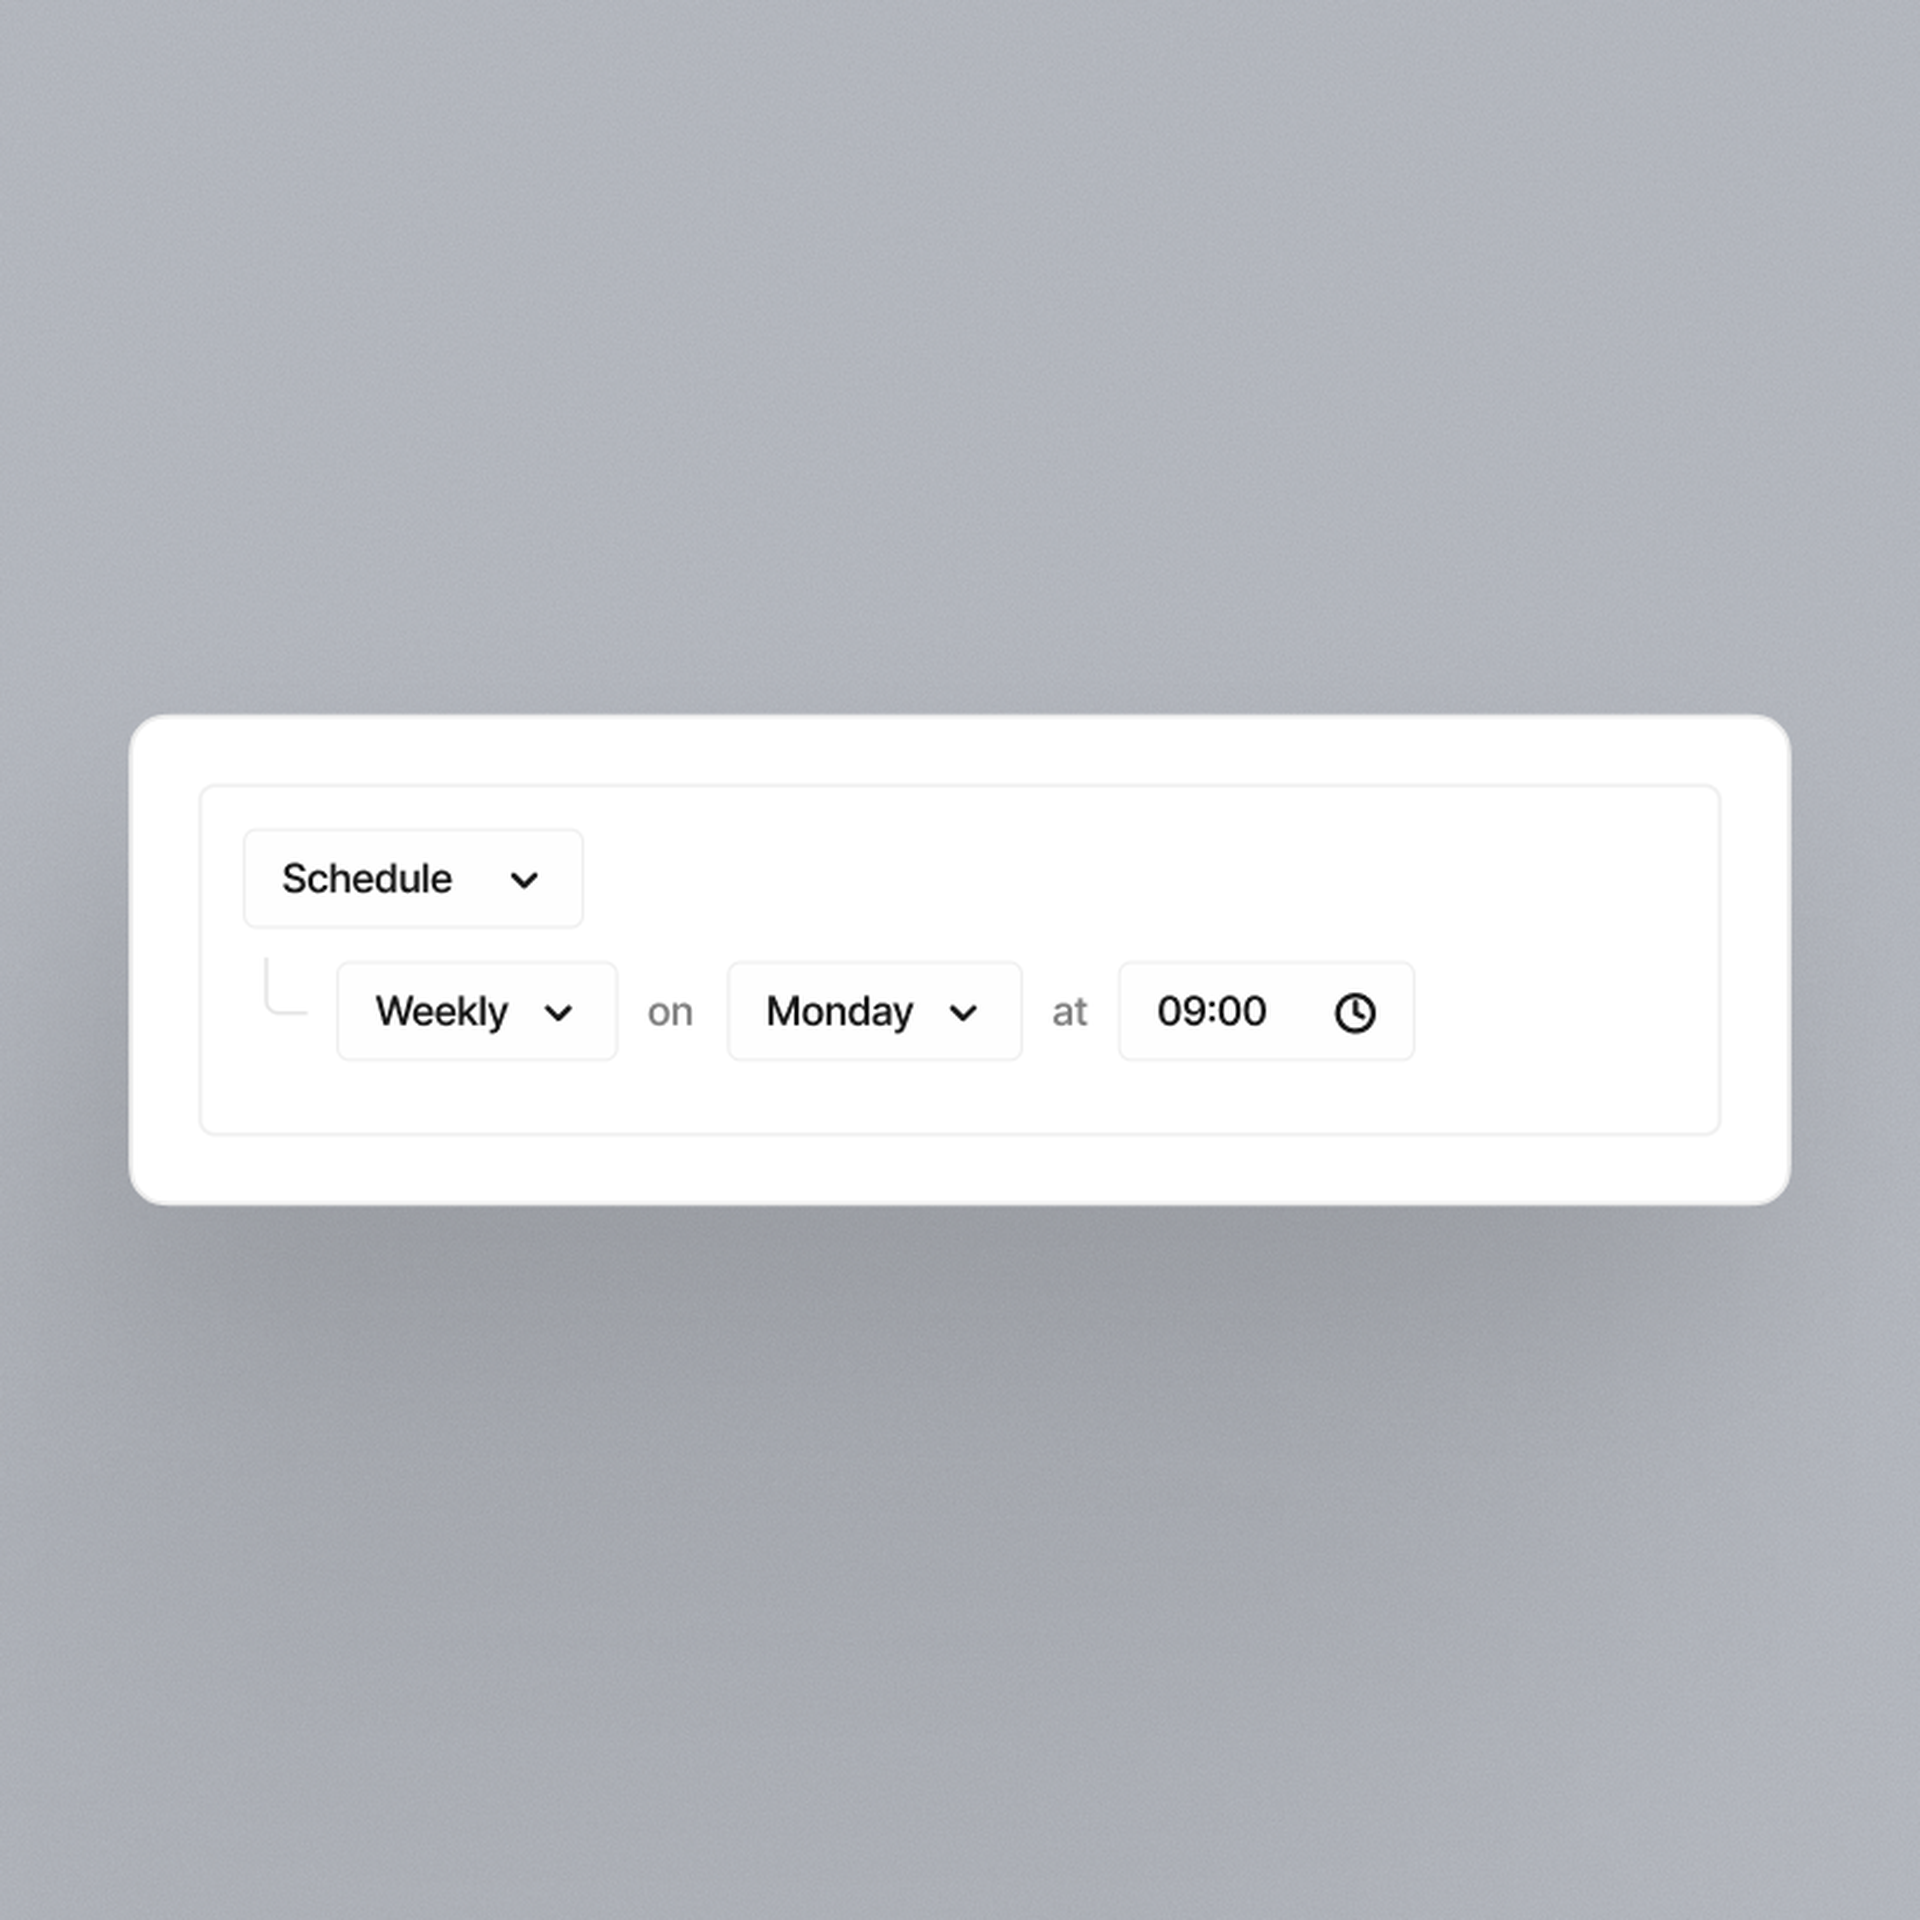
Automations
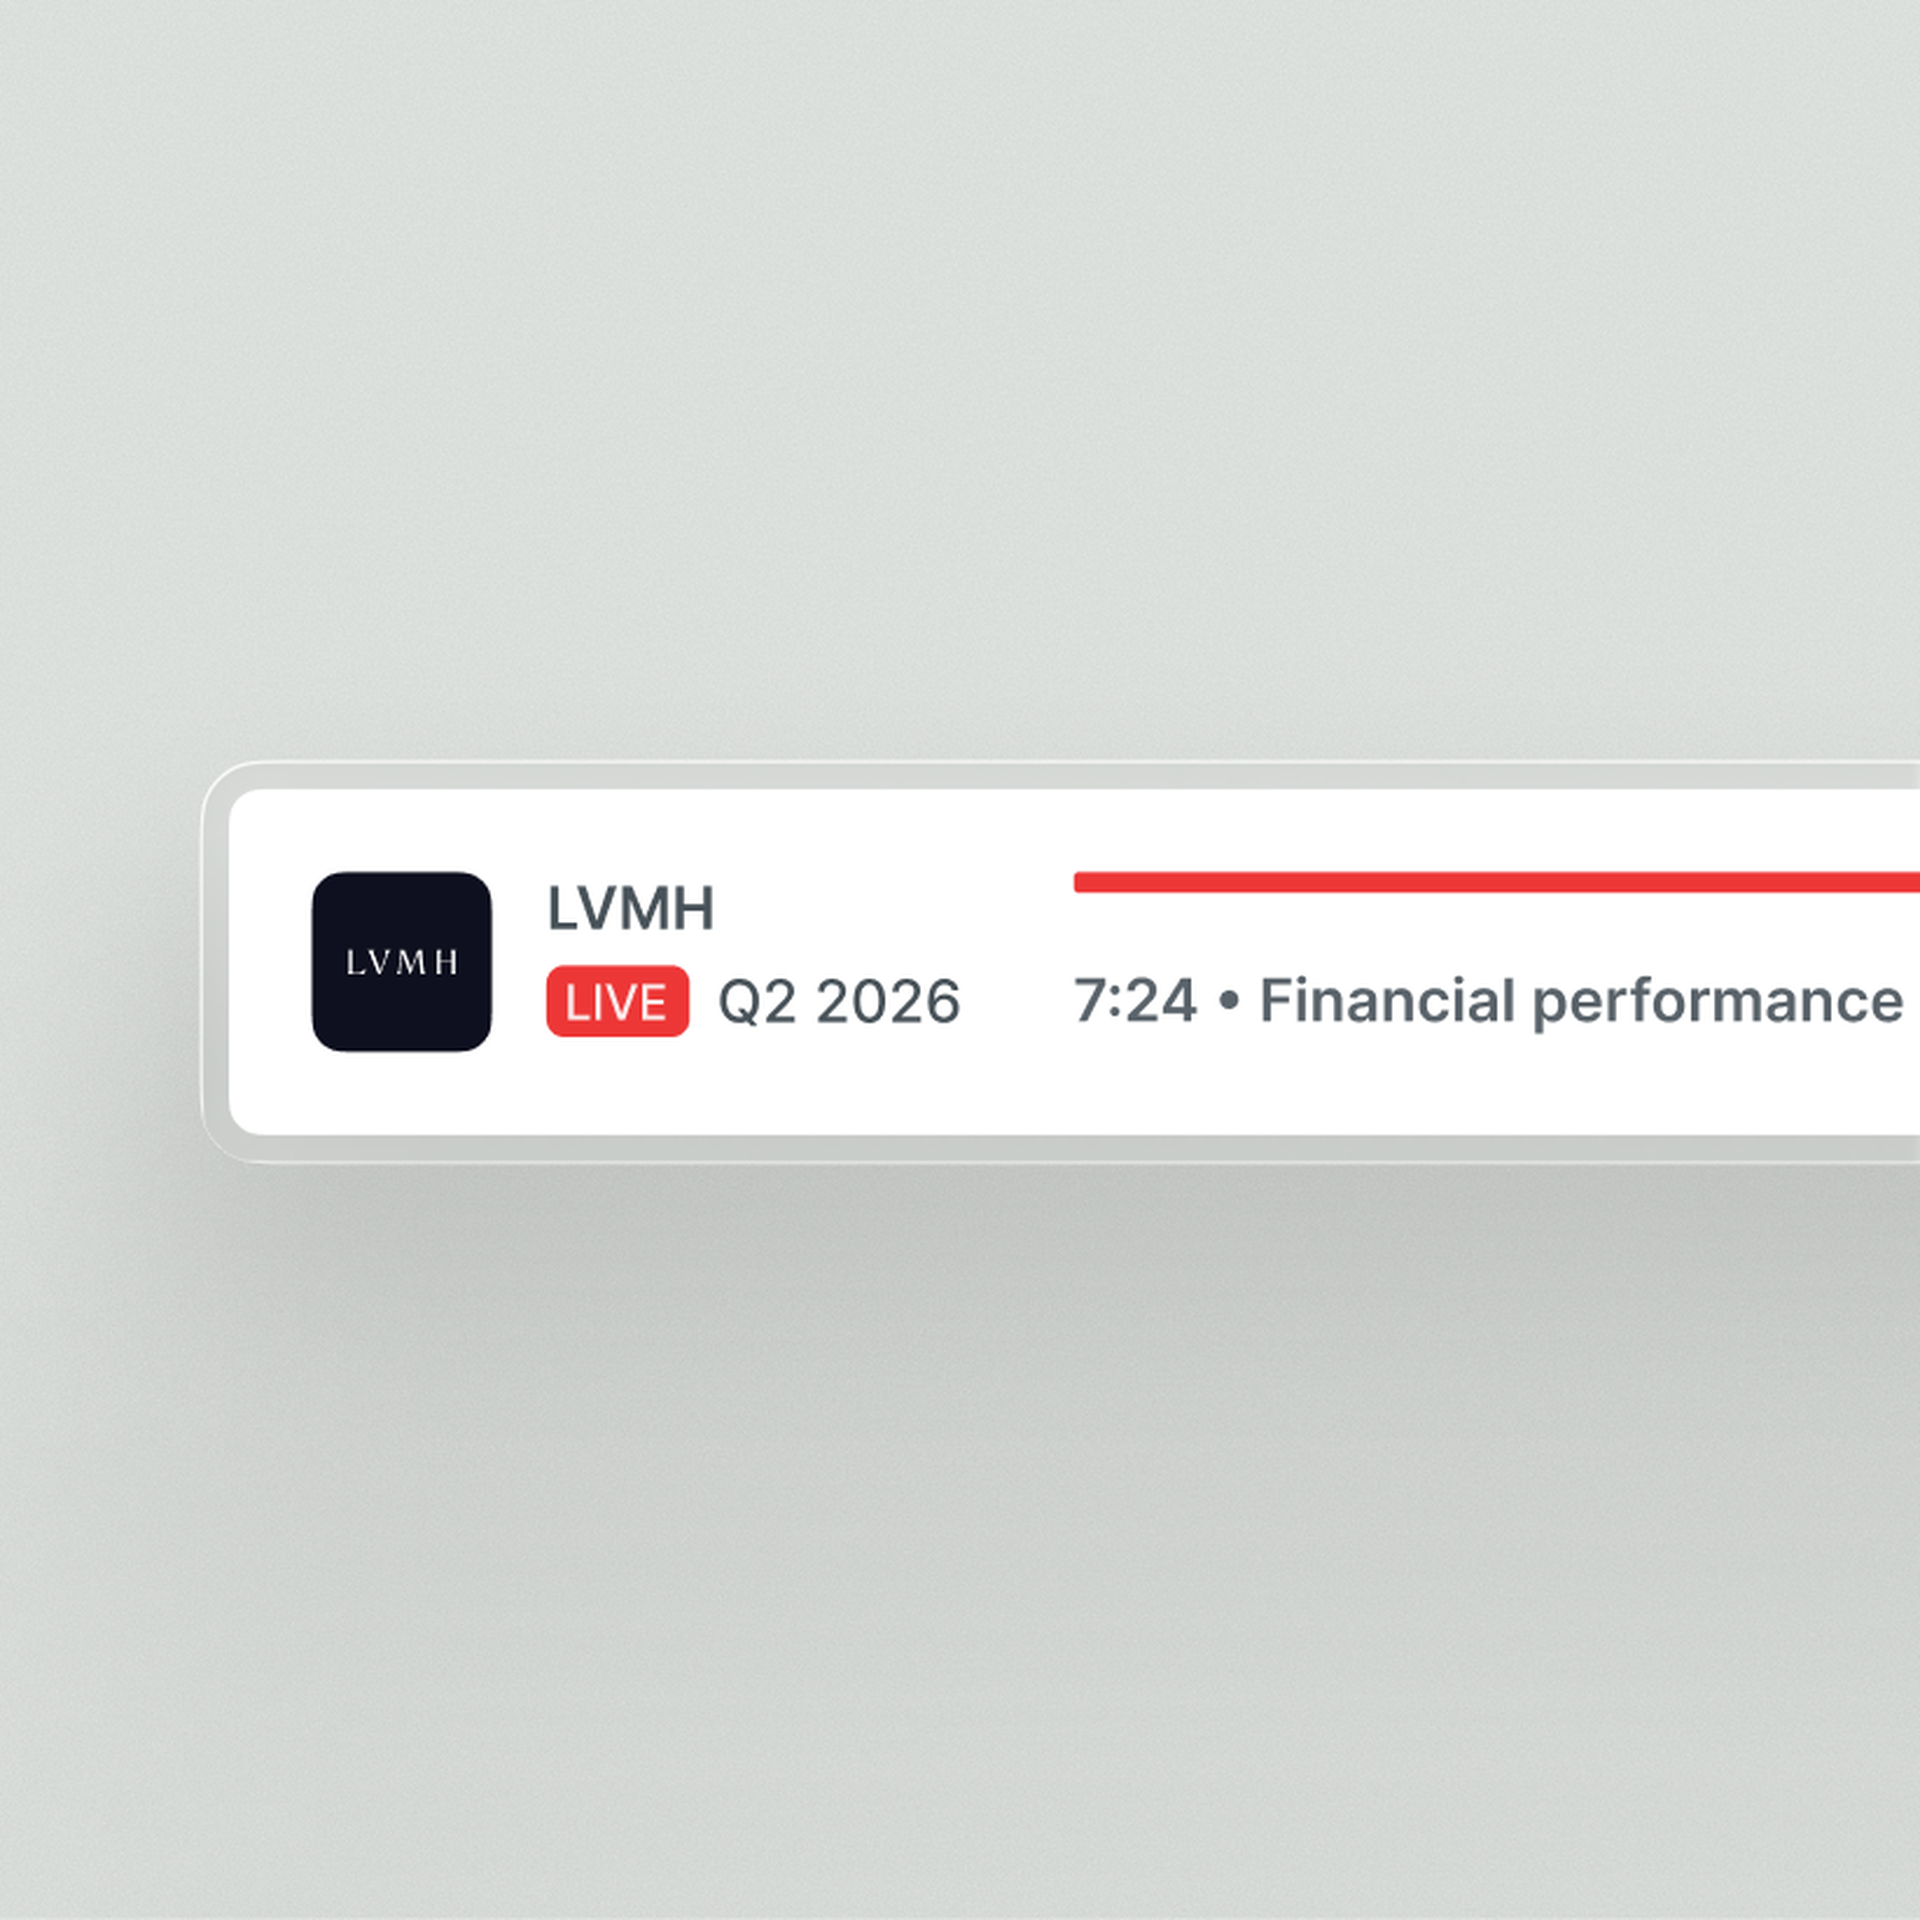
Live audio & transcripts
Quartr's AI stands out because it only pulls clean, first-party data from public companies. In investing, that's everything.
Jamie Ross
Investment Manager, GAM Investments
Research that used to take hours now takes seconds with Quartr Pro. Tracking shifts in tone or extracting tables, it's as simple as typing a query.
Tom O'Hara
Investment Director
Before Quartr we spent hours manually compiling insights through the peer earnings cycle. Now, these tasks are done faster, with greater precision.
Gregg Lampf
VP of Investor Relations
Being able to ask specific questions across years of transcripts and reports and instantly get verified answers is a game-changer.
Pontus Dackmo
CEO & Investment Manager