Edge16 Oct 2026
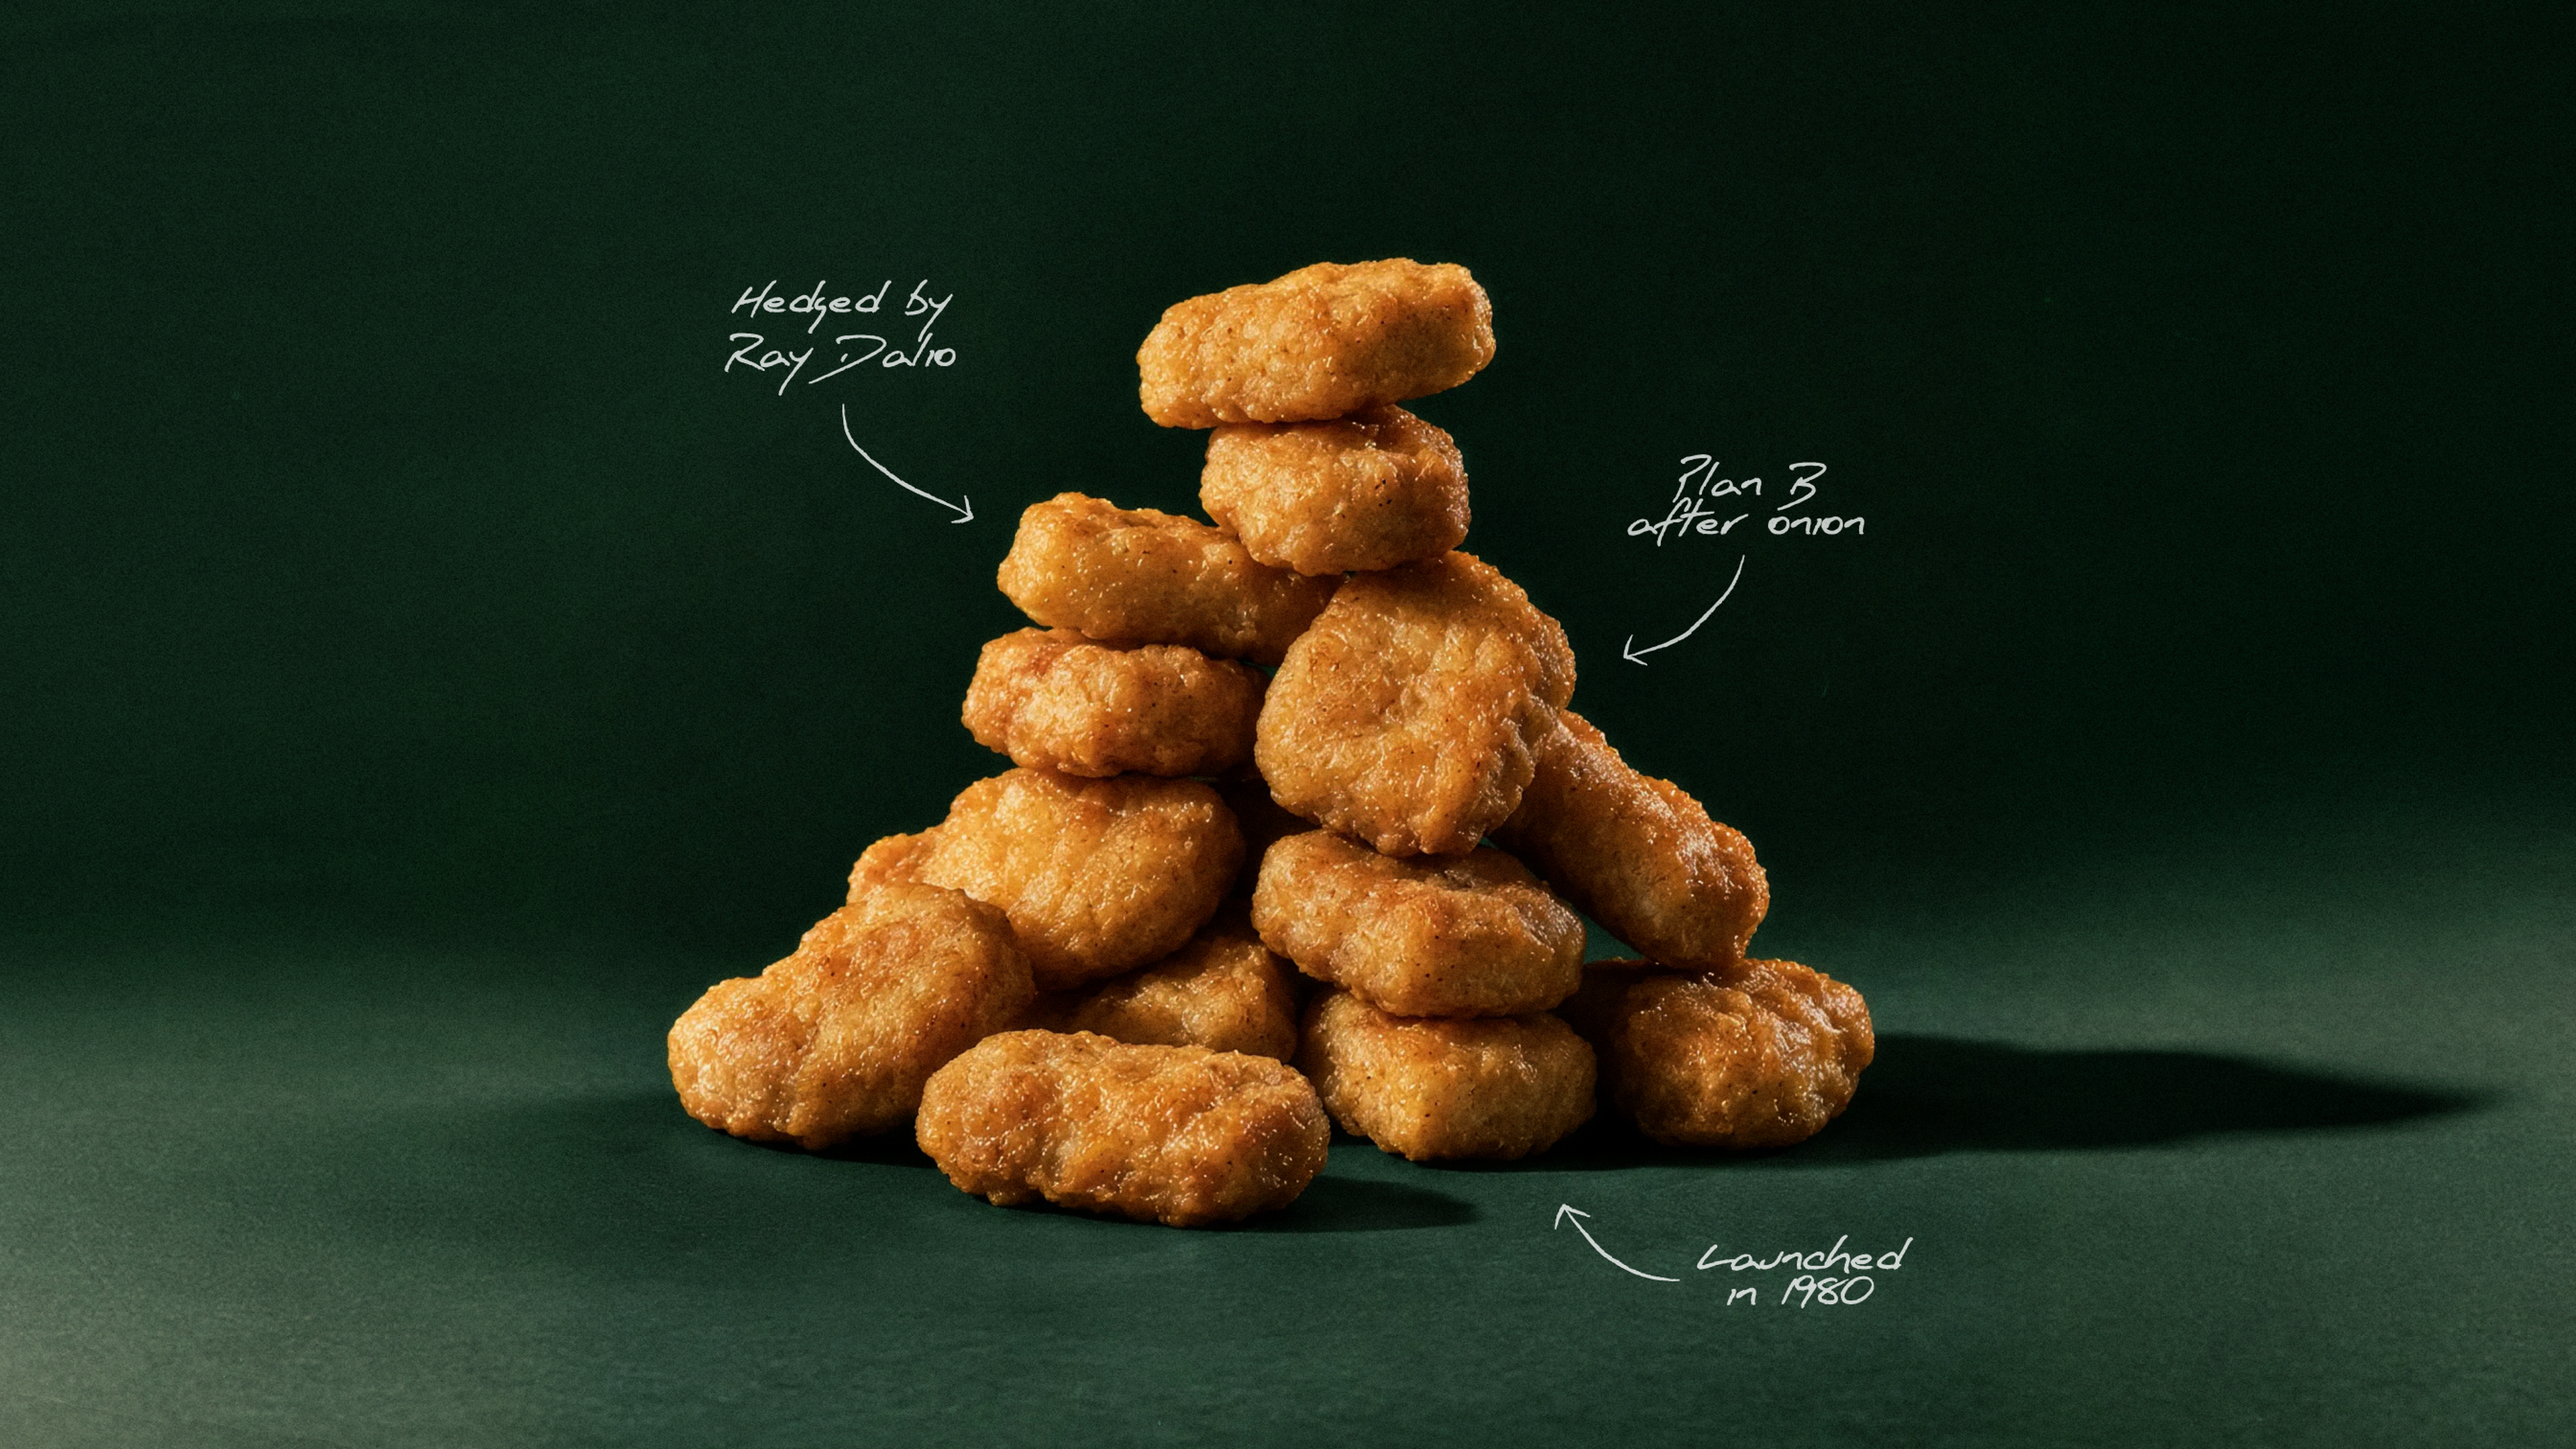
Winner, Winner: The Chicken McNugget Story
How a 1940s breeding contest, a Cornell food scientist, and a hedge by Ray Dalio helped McDonald's turn the Chicken McNugget into a fast-food icon.

Q3 revenue was $1.767B; organic revenue was $871M, up 9% reported and 10% in constant currency, while adjusted EPS rose 21% to $4.10.
Total revenue increased 121% year over year, reflecting the February acquisition of Biosciences & Diagnostic Solutions; legacy revenue grew 9% on broad-based gains.
Strong consumables demand, instrument replacement and acquired-business performance supported a $43M increase to the FY26 reported revenue guidance midpoint.
Adjusted gross margin was 55.8%, adjusted operating margin 30.1%, and adjusted EPS $4.10; GAAP diluted EPS was $0.82.
Q3 GAAP net income was $81M versus $149M; nine-month net loss was $127M versus net income of $417M, reflecting acquisition accounting and related costs.
Adjusted free cash flow was $68M; it included ~$81M of integration, restructuring and SAP costs and $240M of timing items, primarily higher receivables and SAP migration.
Q3 product revenue rose 167% to $1.334B and service revenue rose 44% to $433M; nine-month revenue increased 110% to $4.678B.
Revenue by region was $749M in the Americas, $523M in Europe and $495M in Asia.
FY26 organic constant-currency growth guidance rose 140 bps at midpoint to 9.1%–9.7%; reported revenue guidance increased $43M at midpoint to $6.479B–$6.497B.
FY26 adjusted EPS guidance increased to $14.60–$14.70; adjusted EBIT margin is expected at 28.2%, with a 15.4% tax rate and $196M net interest expense.
Q4 guidance: organic constant-currency growth of 7%–9%, reported revenue of $1.801B–$1.819B and adjusted EPS of $4.58–$4.68; four fewer selling days are assumed.
Q4 guidance assumes double-digit days-adjusted growth in organic and acquired businesses; midpoint implies a 14% sequential organic revenue step-up.
2027 preliminary framework: mid-single-digit-plus combined organic growth, 29.2% adjusted operating margin and low-teens adjusted EPS growth; estimates are not guidance.

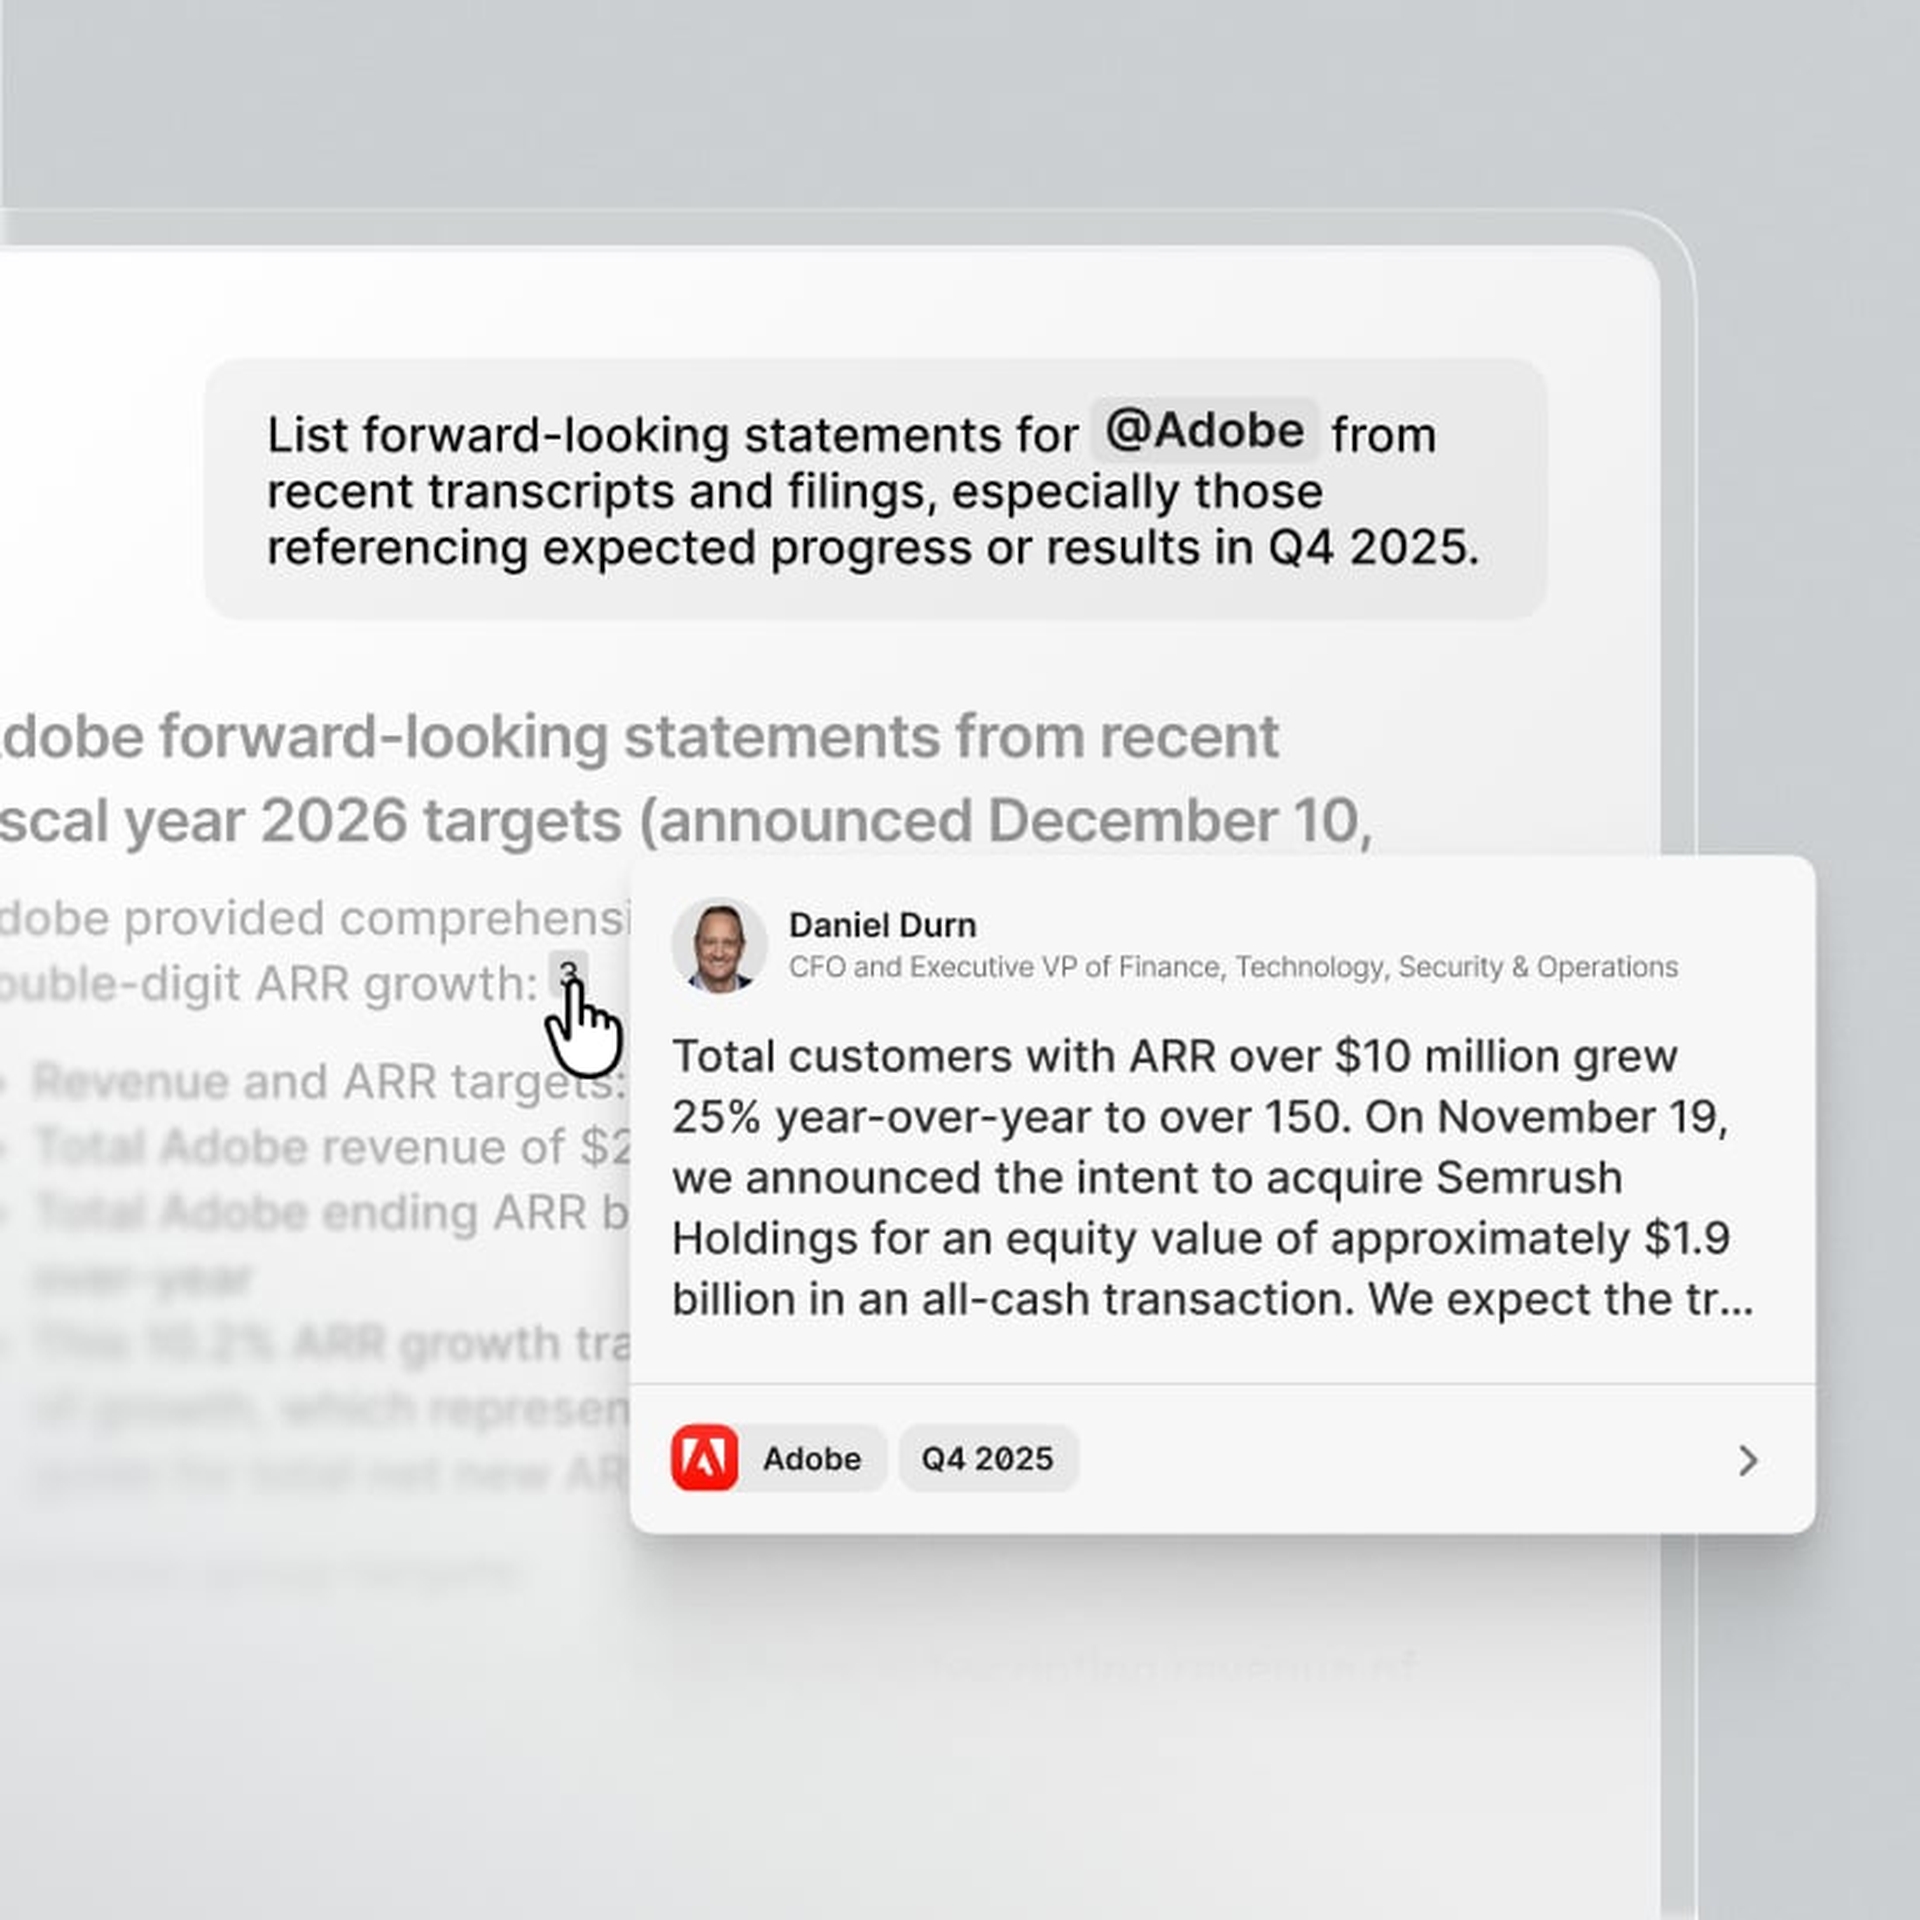
AI chat
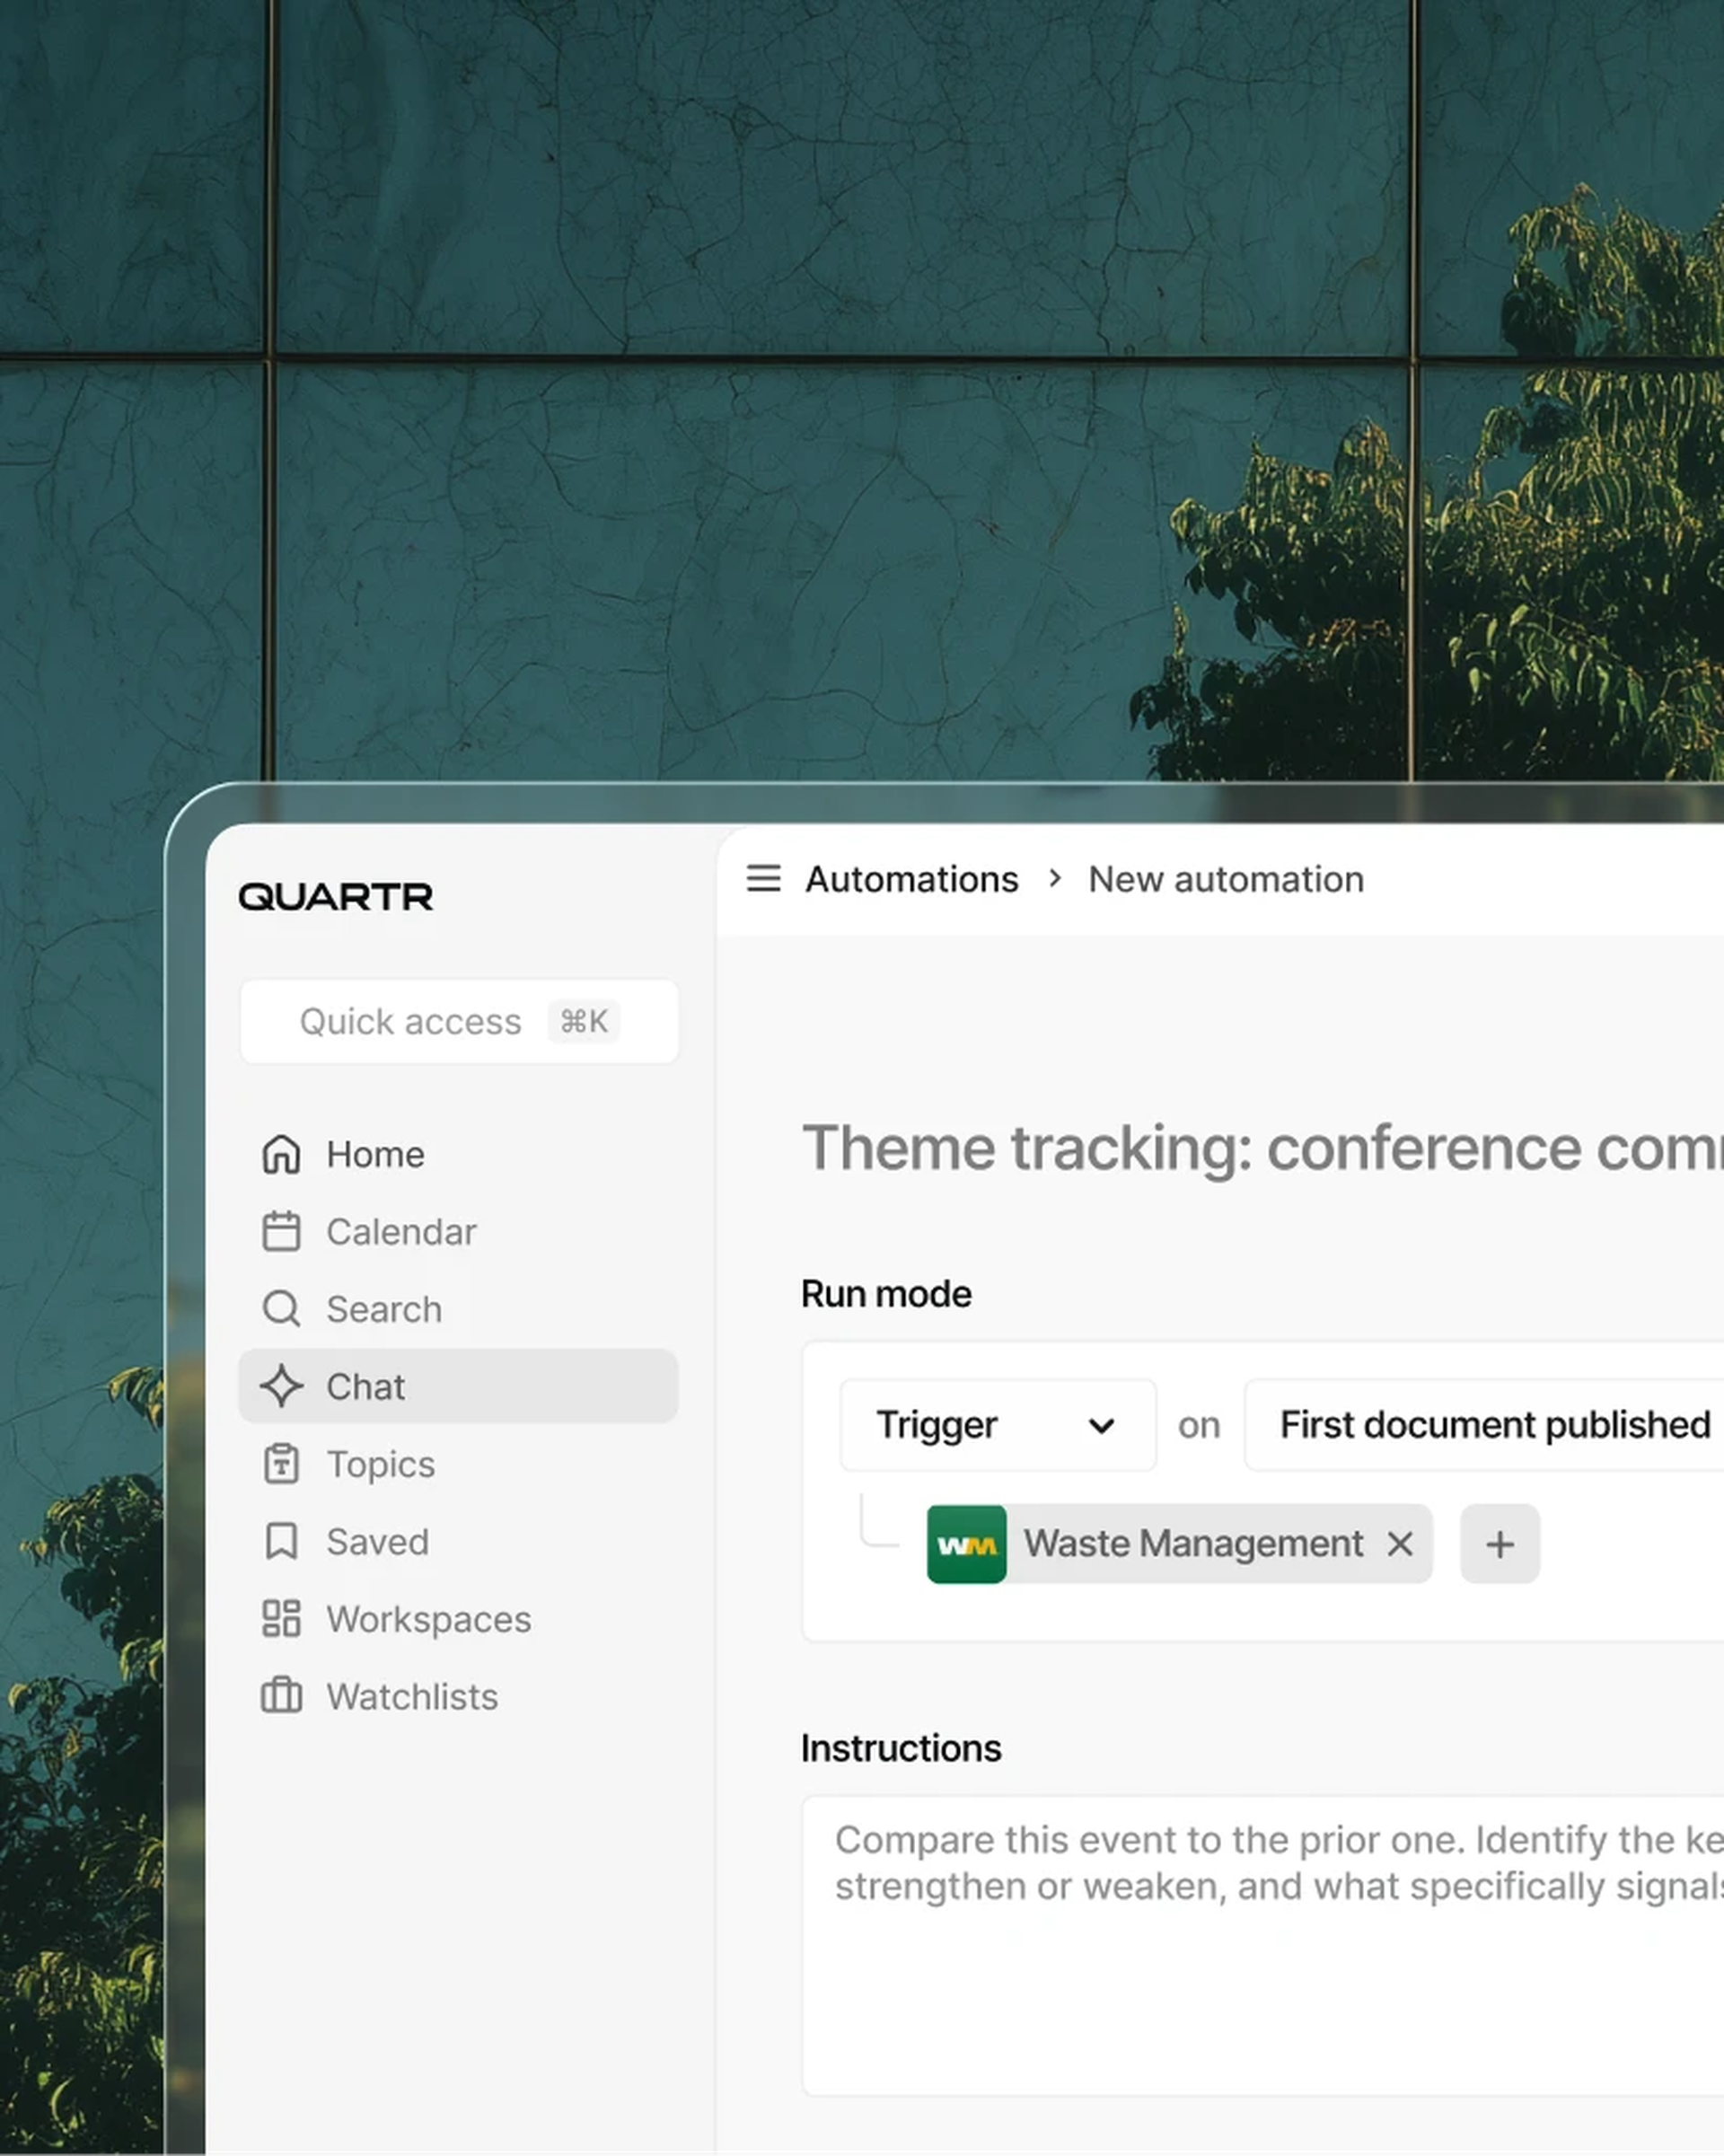
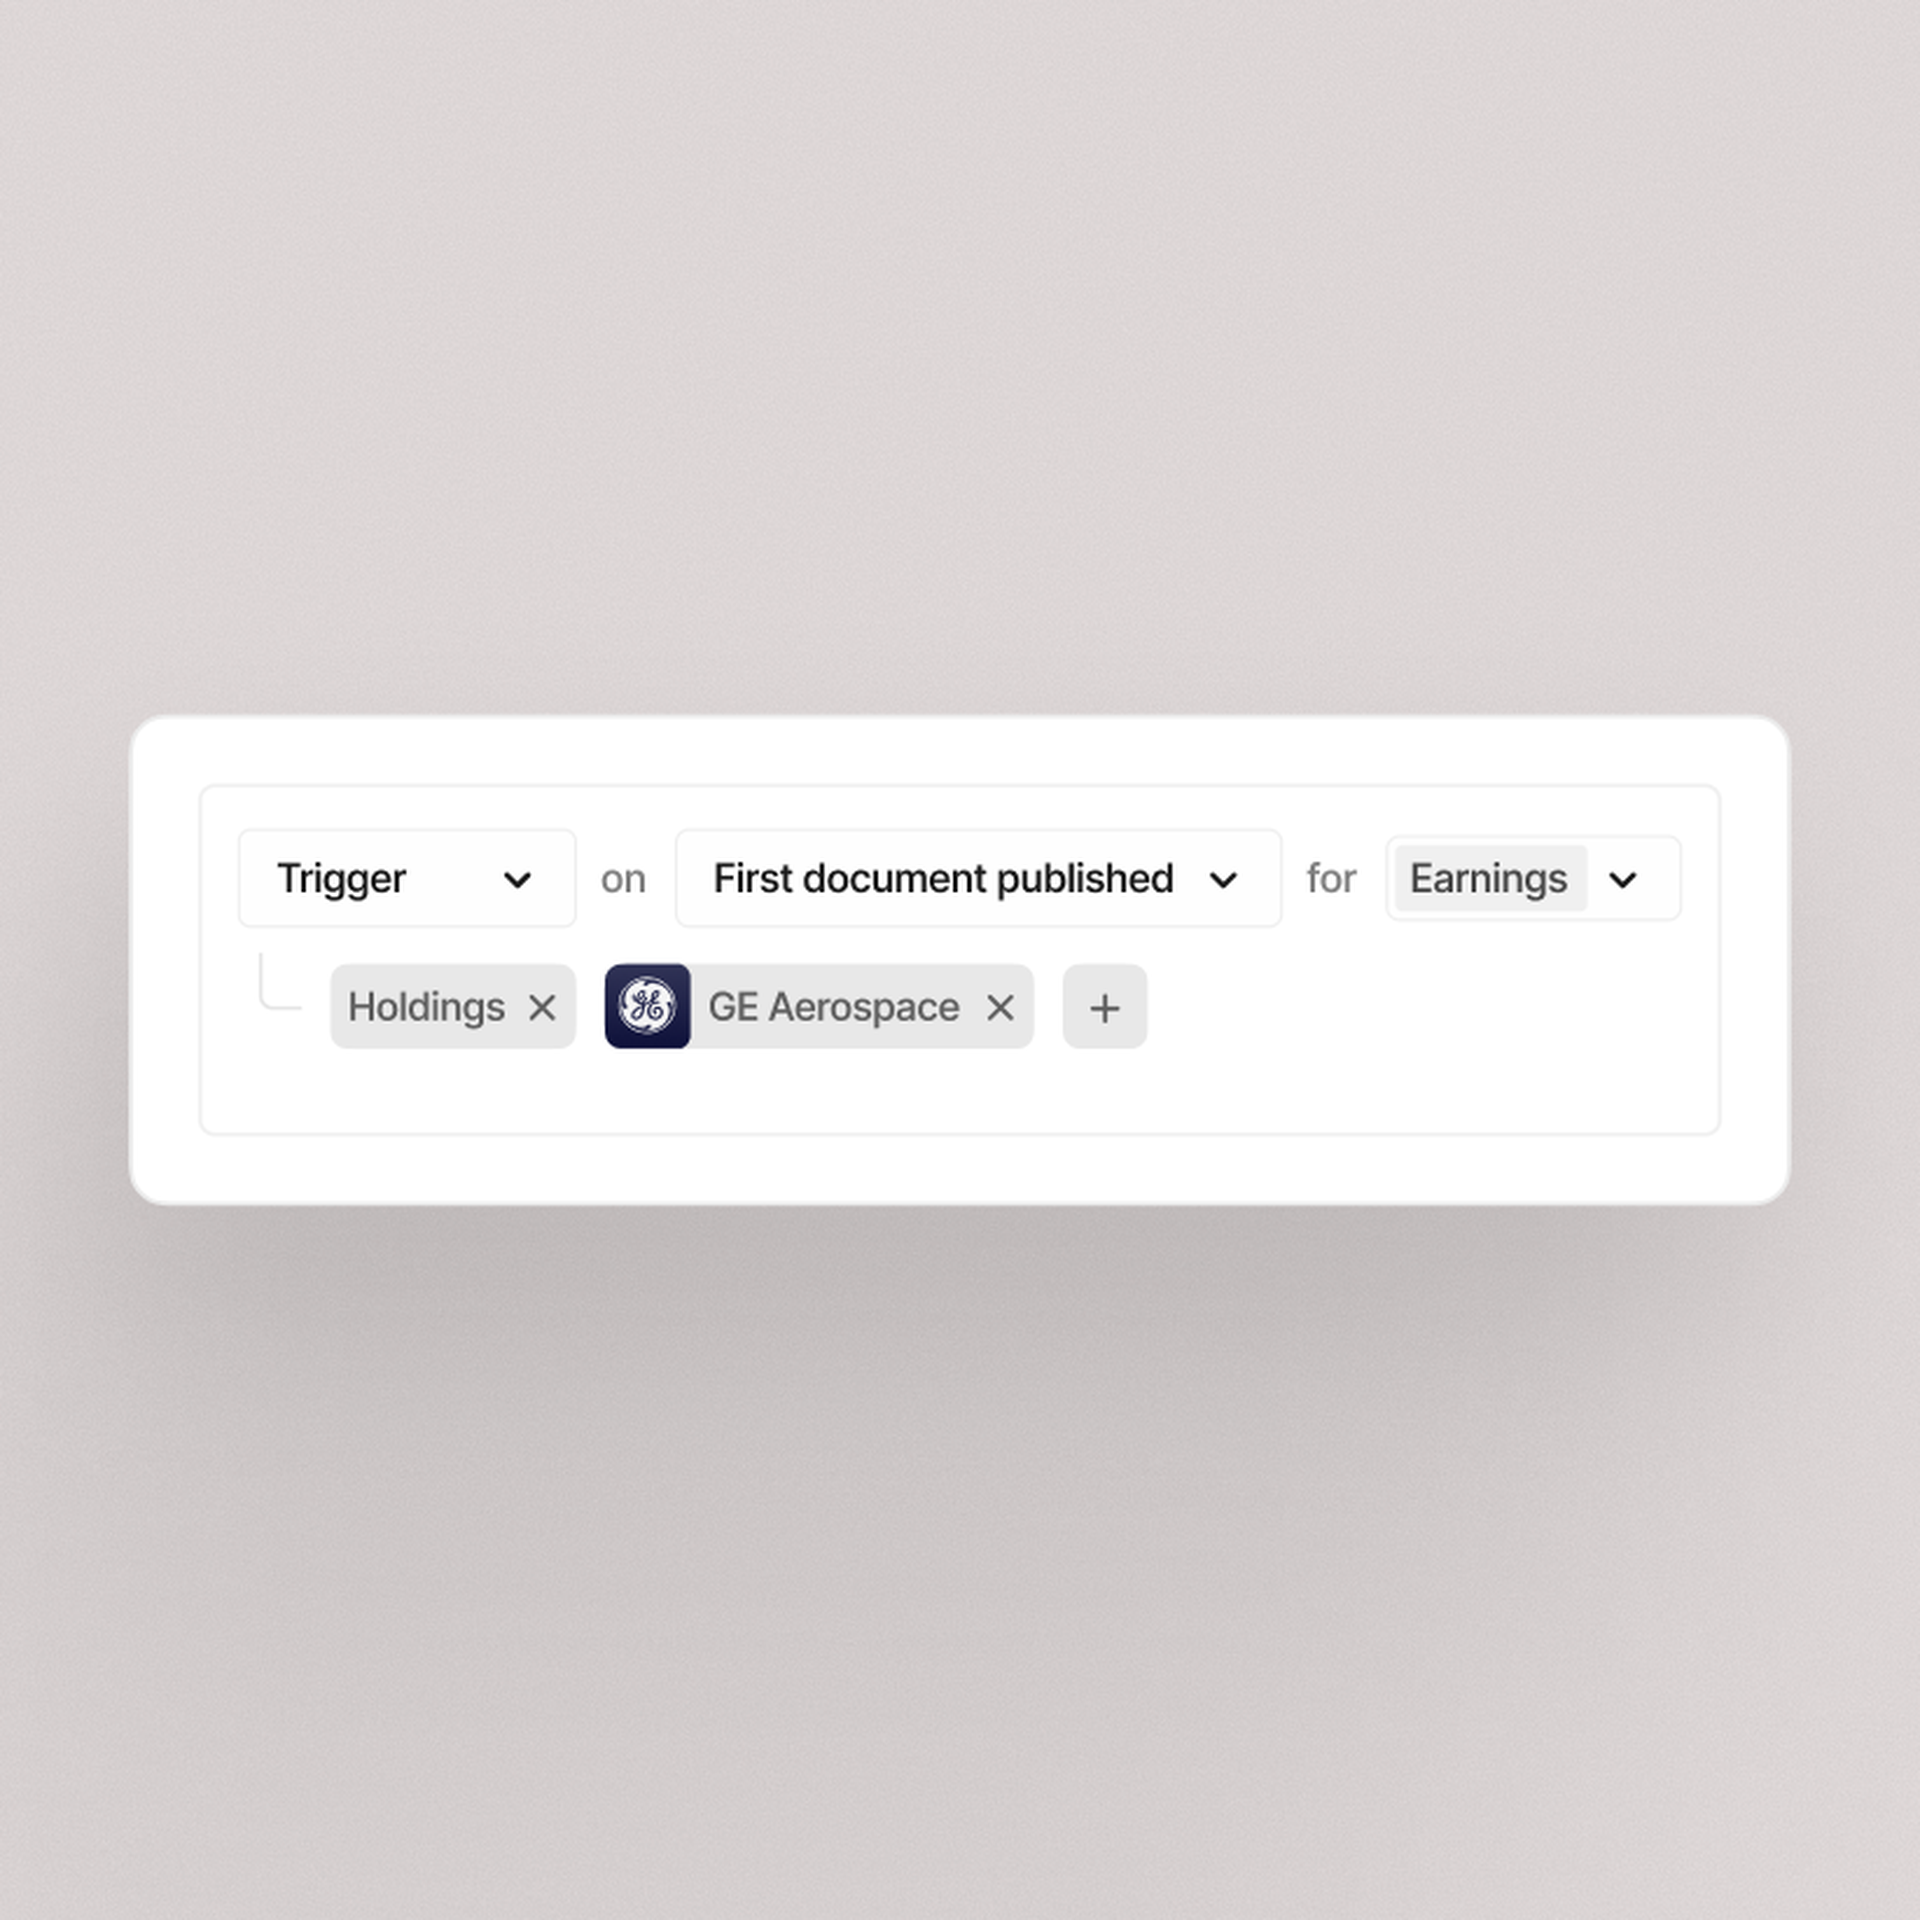
Automations

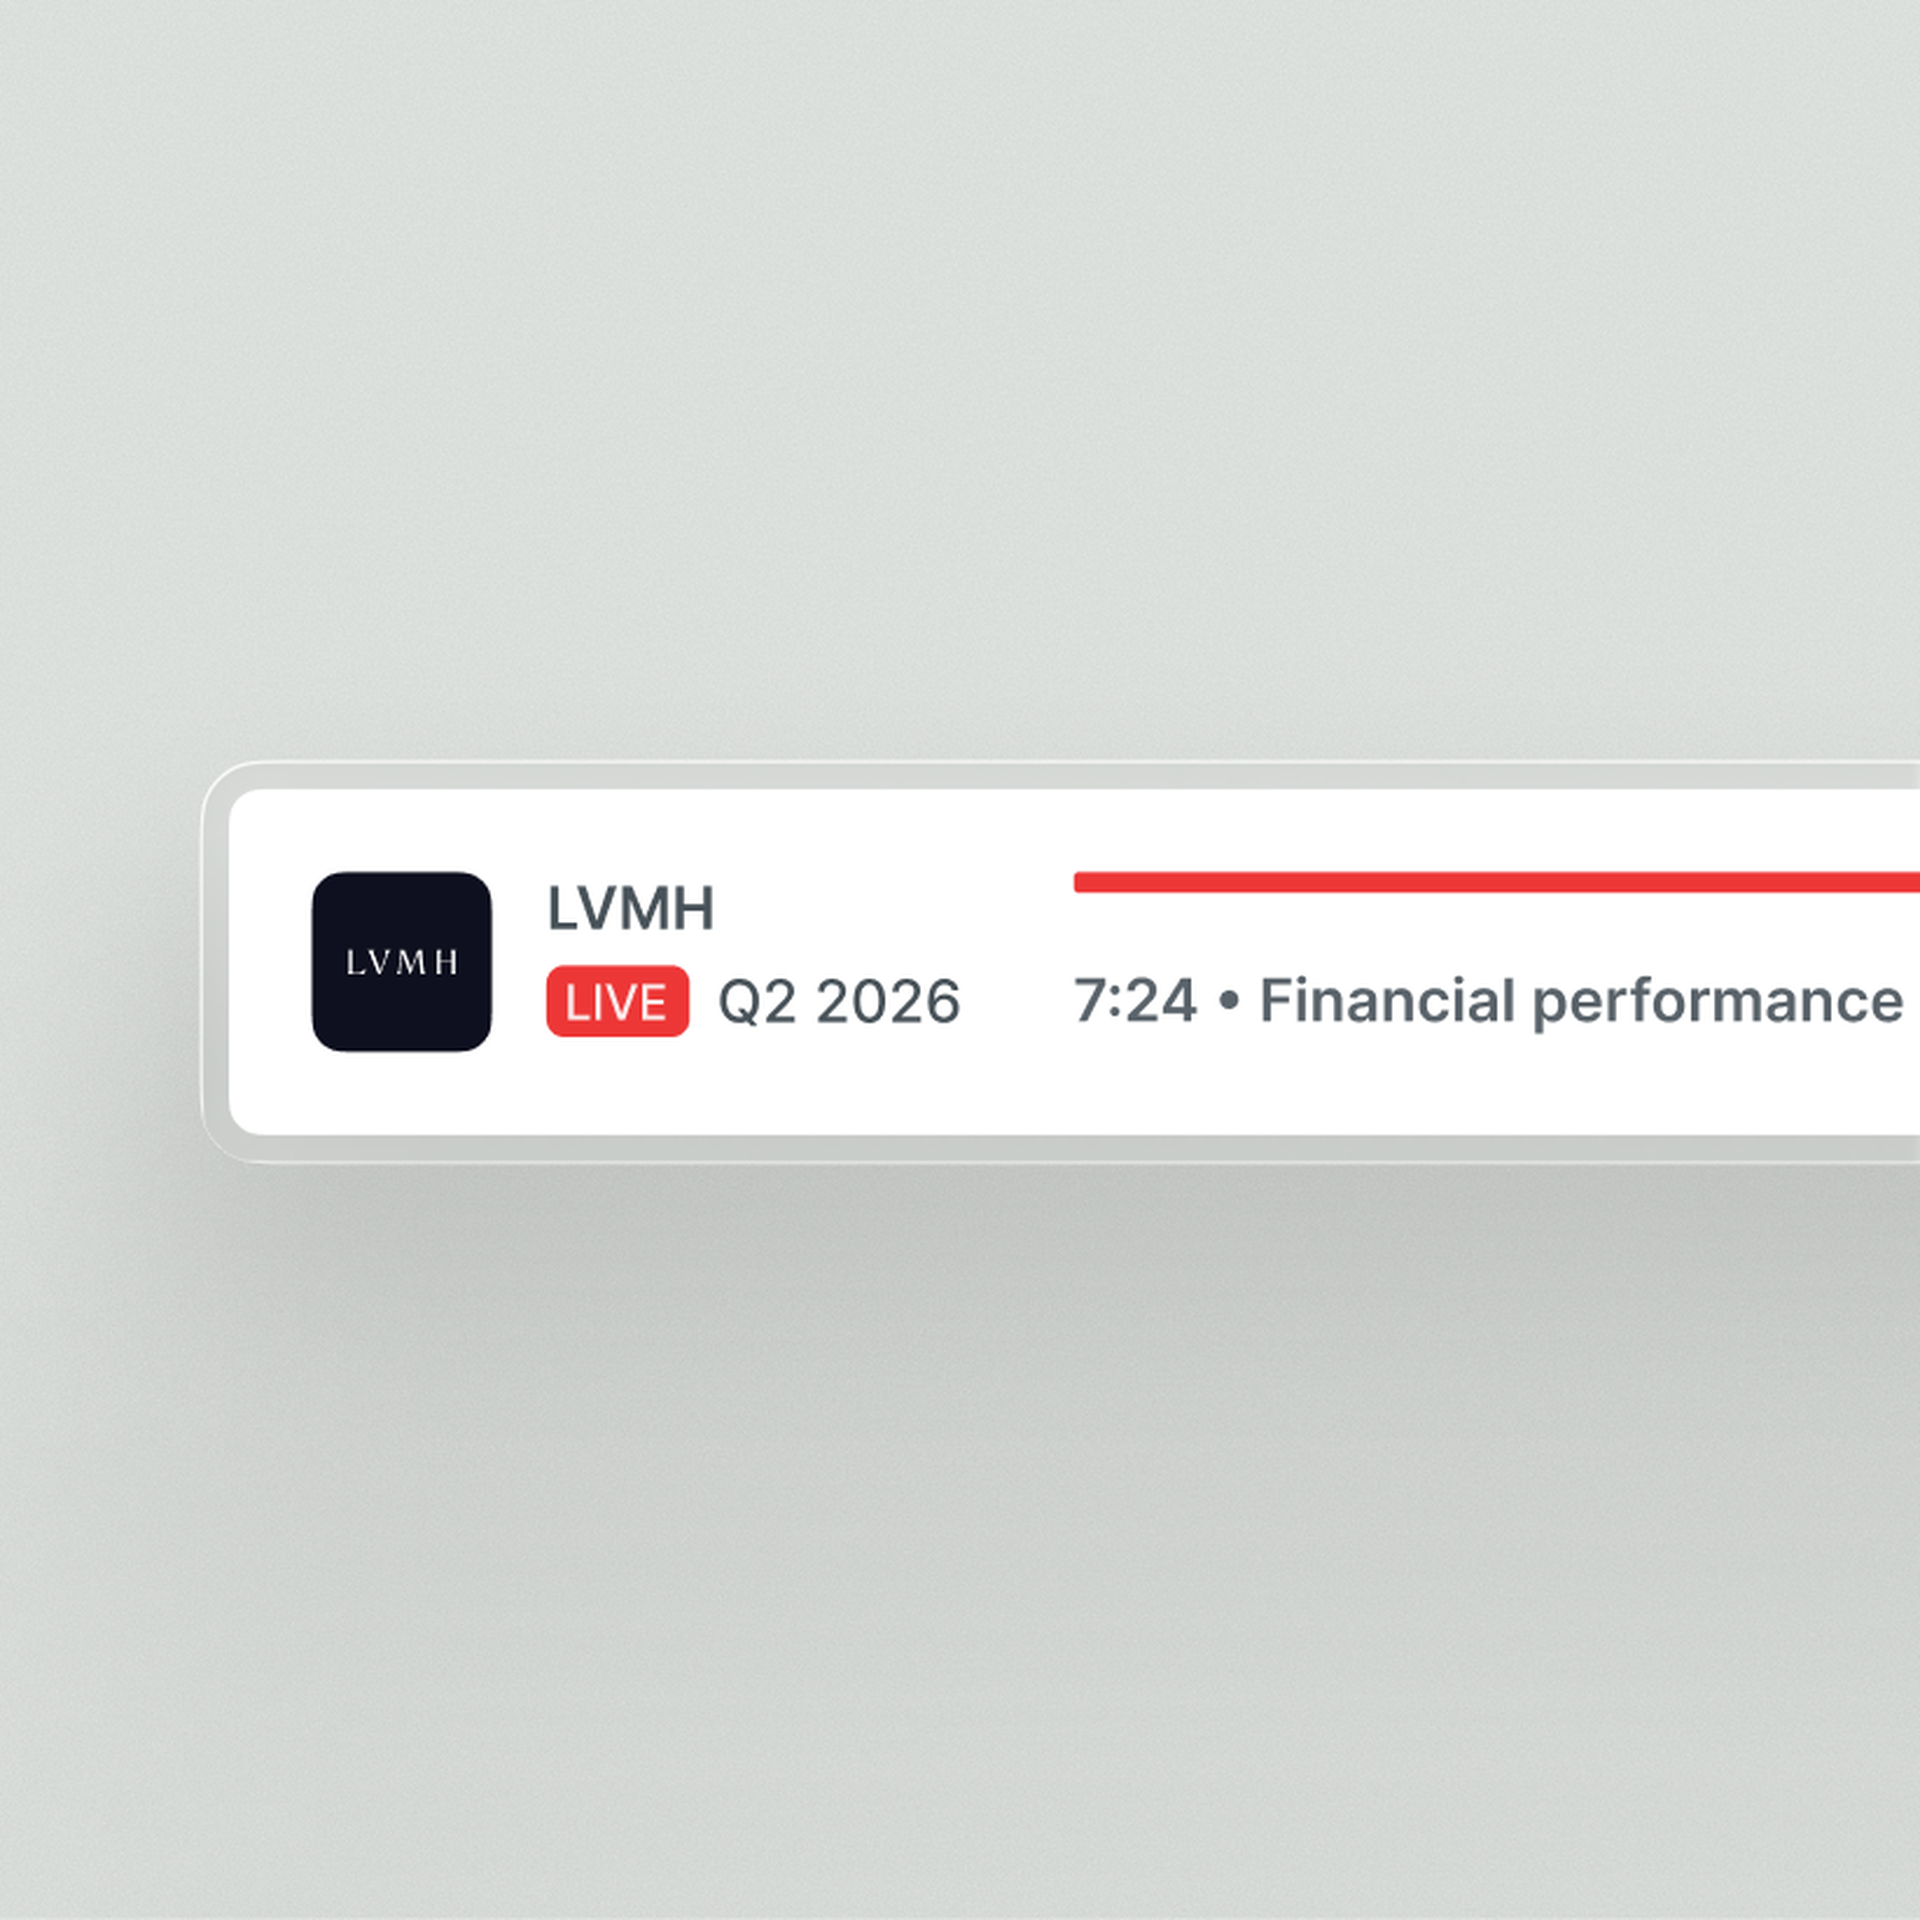
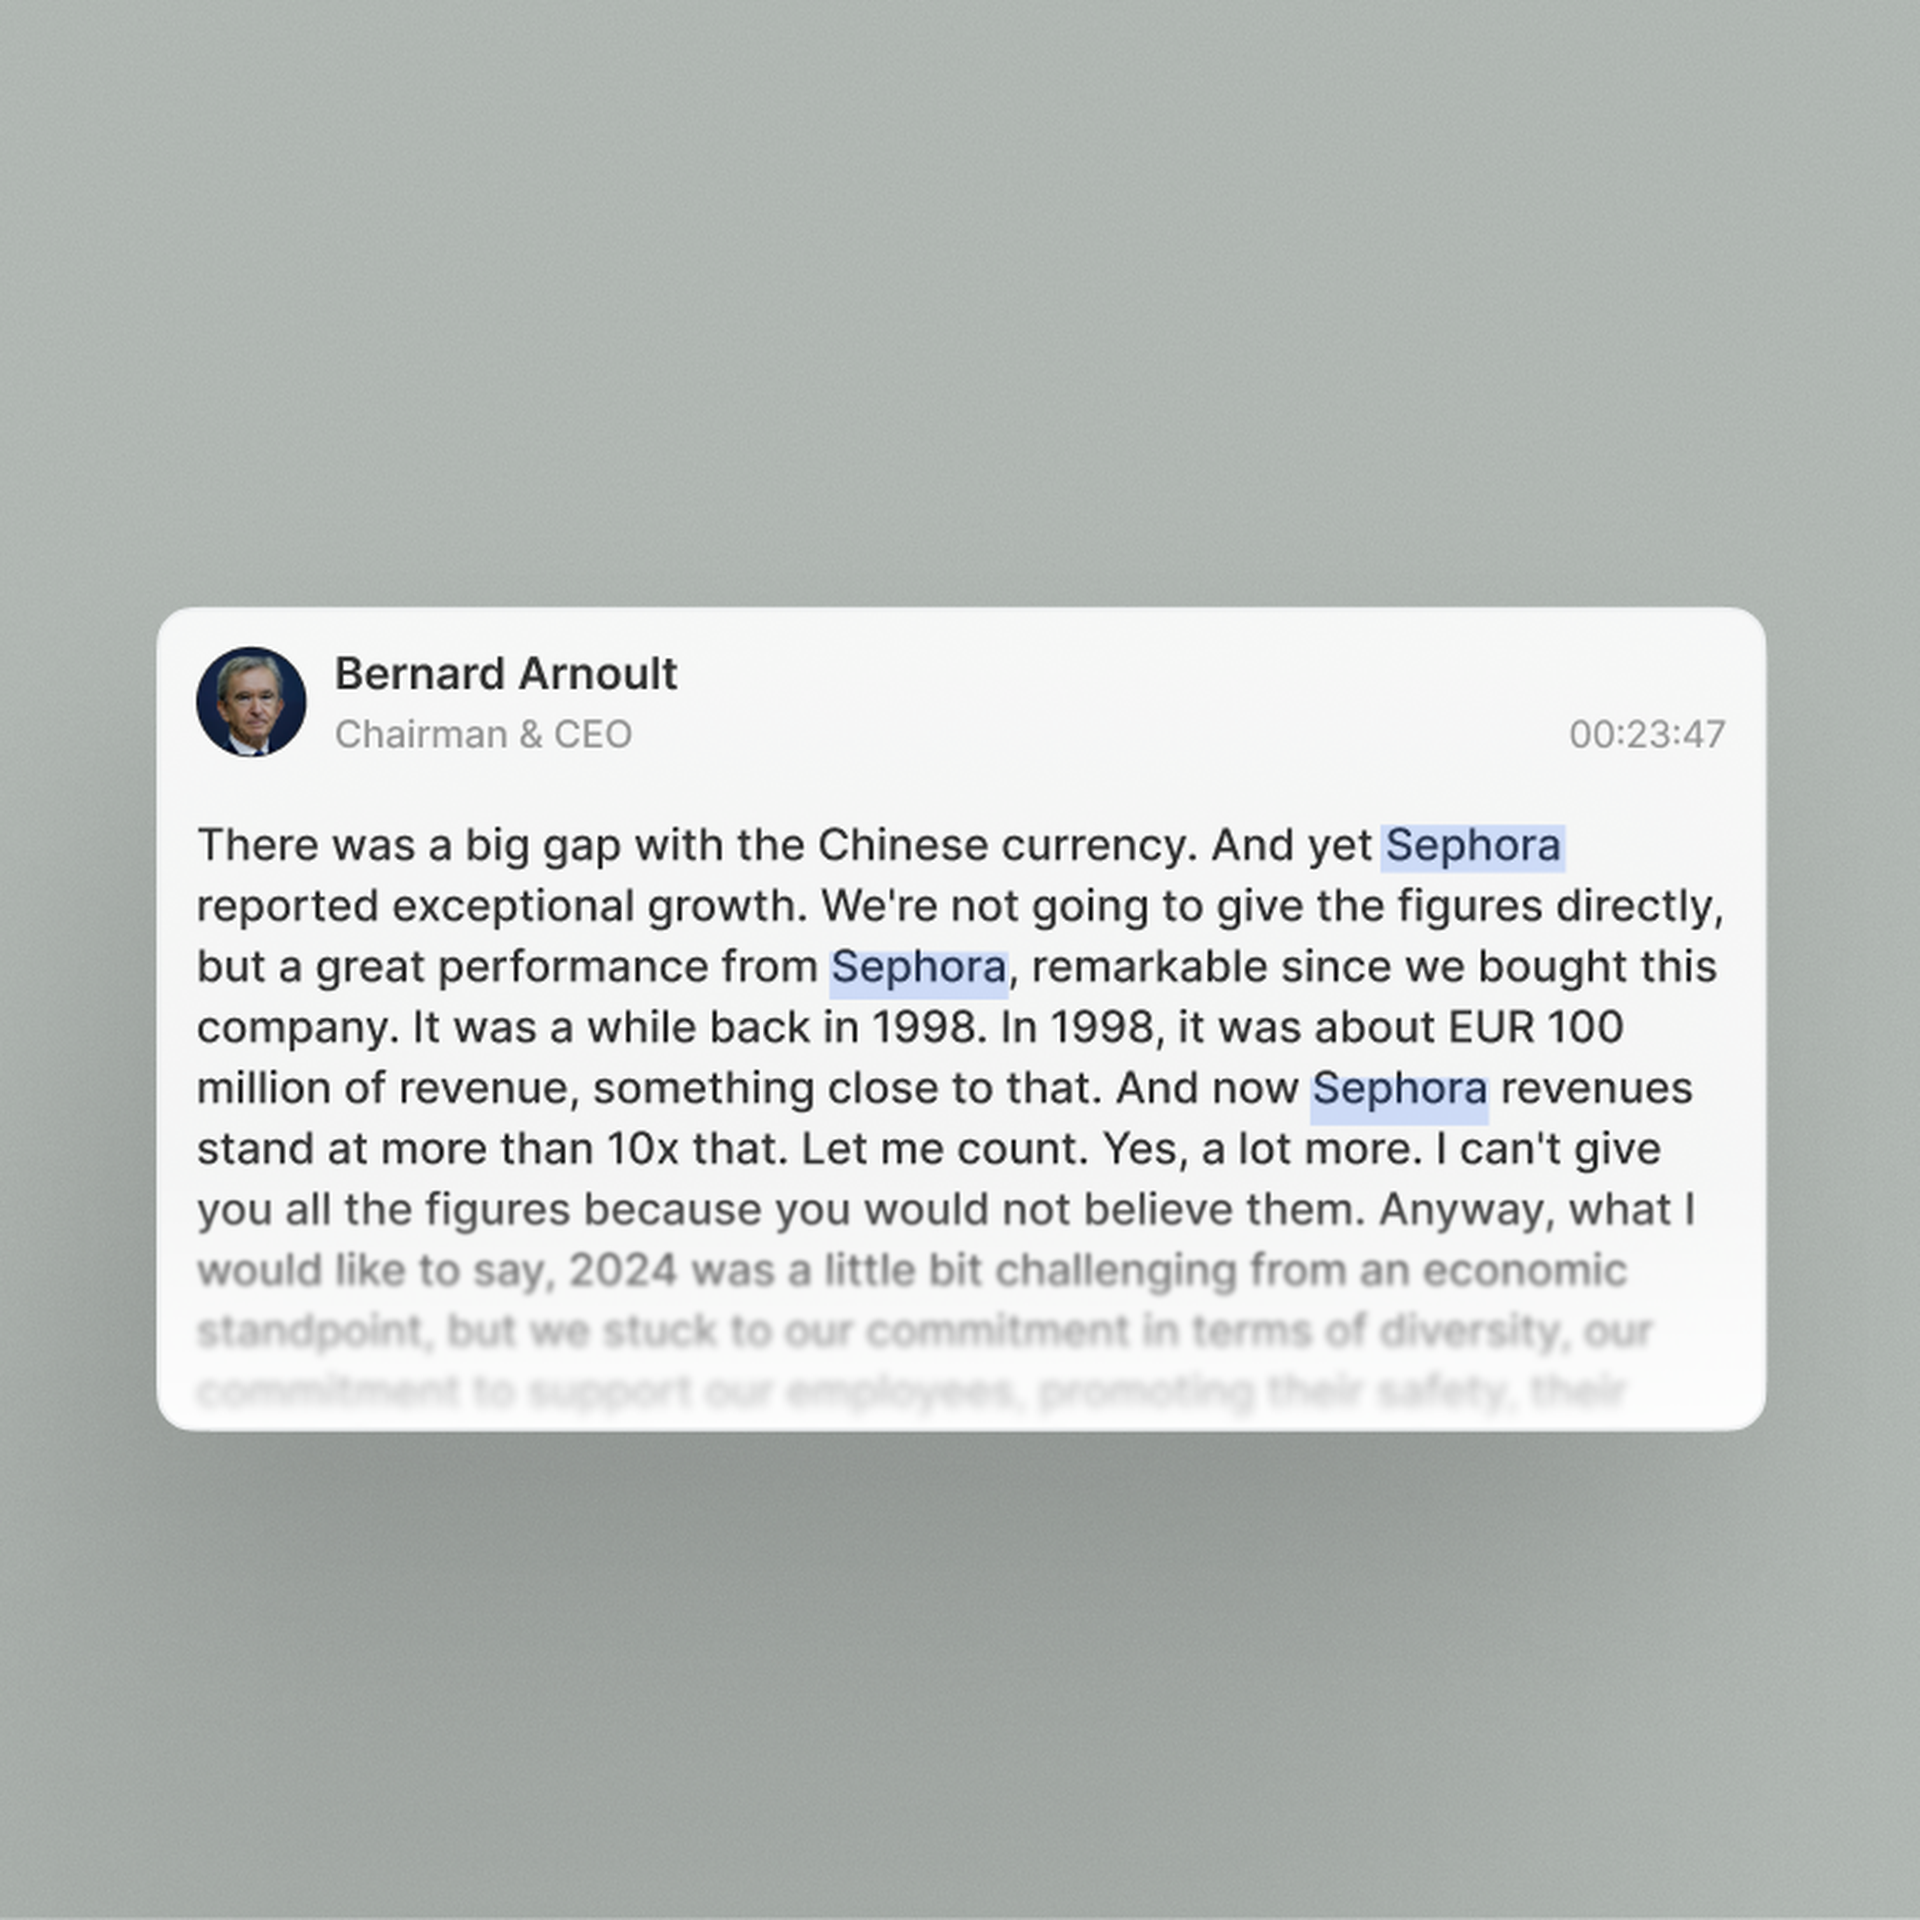
Live audio & transcripts
Quartr's AI stands out because it only pulls clean, first-party data from public companies. In investing, that's everything.
Jamie Ross
Investment Manager, GAM Investments
Research that used to take hours now takes seconds with Quartr Pro. Tracking shifts in tone or extracting tables, it's as simple as typing a query.
Tom O'Hara
Investment Director
Before Quartr we spent hours manually compiling insights through the peer earnings cycle. Now, these tasks are done faster, with greater precision.
Gregg Lampf
VP of Investor Relations
Being able to ask specific questions across years of transcripts and reports and instantly get verified answers is a game-changer.
Pontus Dackmo
CEO & Investment Manager