Edge16 Oct 2026
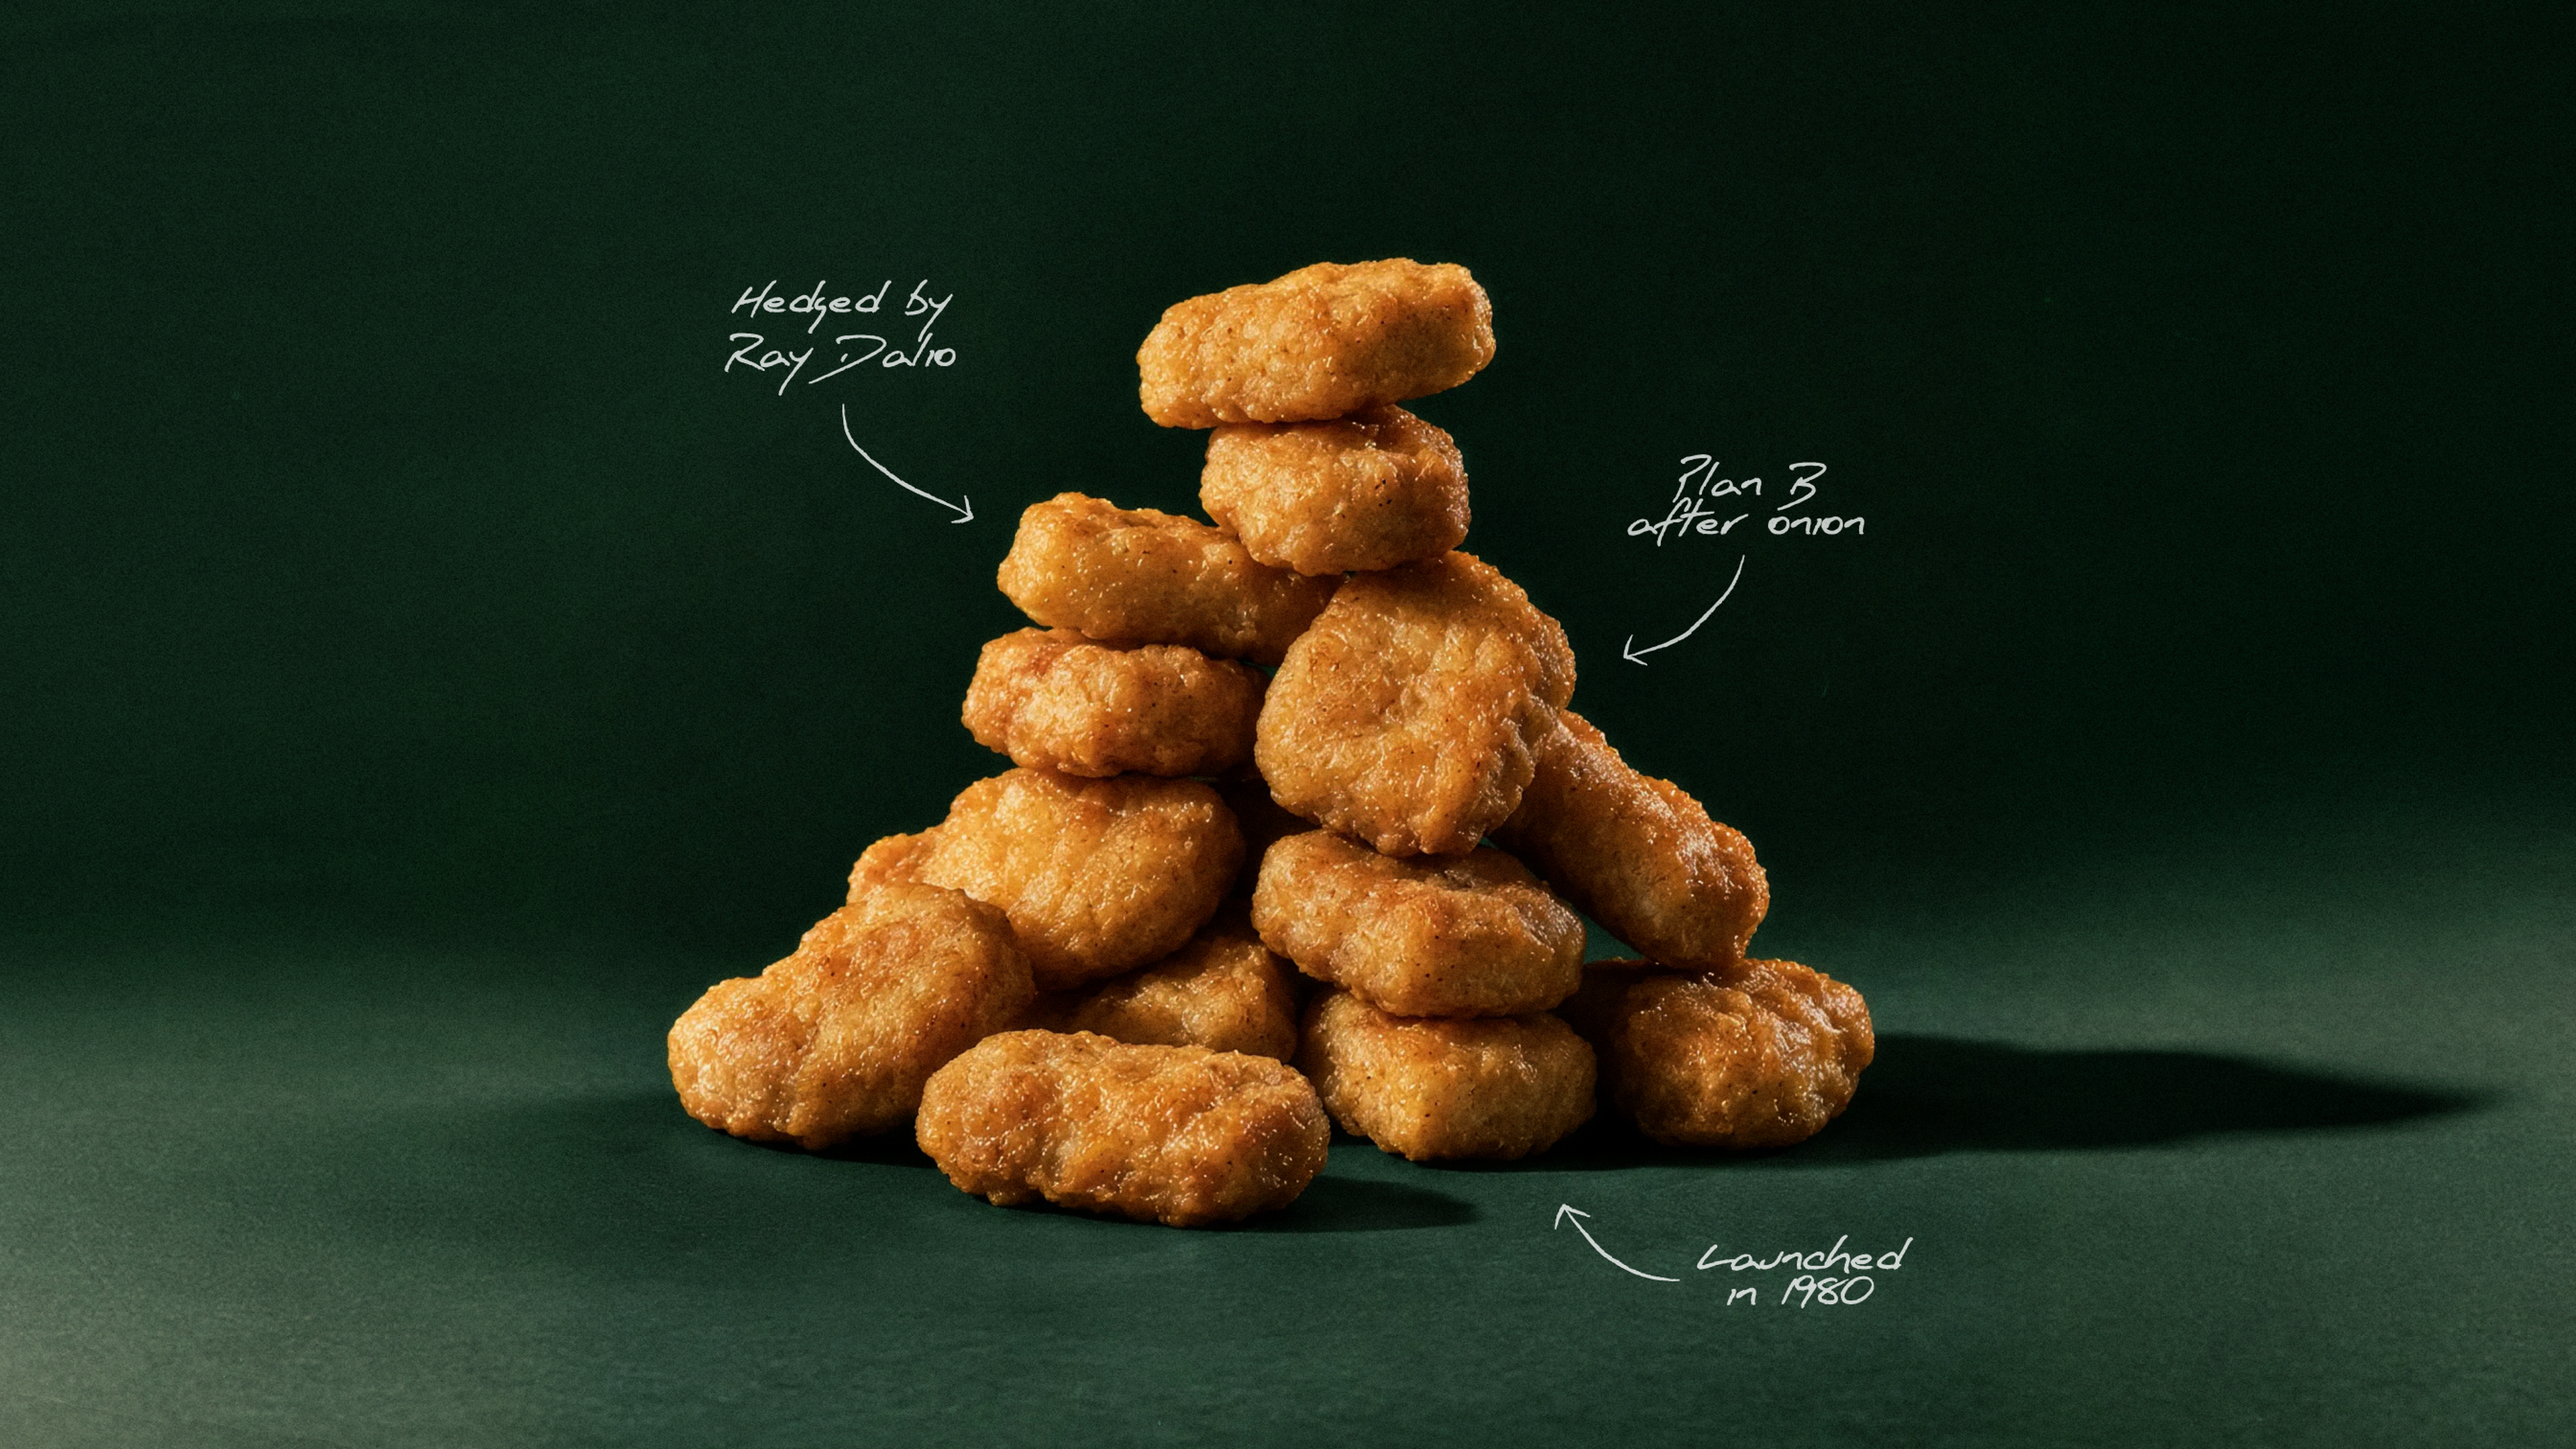
Winner, Winner: The Chicken McNugget Story
How a 1940s breeding contest, a Cornell food scientist, and a hedge by Ray Dalio helped McDonald's turn the Chicken McNugget into a fast-food icon.

Q3 same-property NOI grew 10.2%, led by 15.2% street retail growth; FFO As Adjusted rose to $0.31/share from $0.29.
Leasing momentum, rent resets and accretive street acquisitions supported earnings growth; Henderson Avenue reached ~90% of retail GLA leased or in advanced negotiations.
FY26 same-property NOI guidance increased to 7.5%–8.5%; FFO guidance was maintained, while net earnings guidance was reduced after a non-cash impairment.
Q3 revenue was $95.0M versus $101.0M; net loss attributable to shareholders was $3.6M versus $5.6M income, with EPS of $(0.03) versus $0.03.
Q3 NAREIT FFO was $44.5M, or $0.30/share, versus $38.6M, or $0.28/share; FFO As Adjusted was $45.2M, or $0.31/share, versus $39.7M, or $0.29/share.
9M net income attributable to shareholders rose to $37.9M from $9.2M, including $146.9M of property disposition and deconsolidation gains; 9M FFO As Adjusted was $0.92/share versus $0.84.
9M NAREIT FFO attributable to common shareholders and OP Unit holders was $124.6M versus $121.2M; NAREIT FFO/share was $0.87 versus $0.89.
FY26 same-property NOI growth guidance was raised to 7.5%–8.5% from the original 5%–9% range; 9M growth was 8.3%.
FY26 NAREIT FFO guidance remained $1.19–$1.21/share and FFO As Adjusted guidance remained $1.24–$1.26/share.
FY26 net earnings guidance was reduced to $0.29–$0.30/share from $0.40–$0.41; depreciation and amortization guidance rose to $1.00–$1.01 from $0.96–$0.97.
2027 is expected to deliver another strong year of REIT same-property NOI growth, including redevelopments; no formal 2027 guidance was issued.
Current SNO pipeline is expected to add ~$0.01/share FFO in Q4, $0.06–$0.08 in 2027 and the balance in 2028; full run-rate impact is ~$0.11/share, net of ~$0.04 currently capitalized.

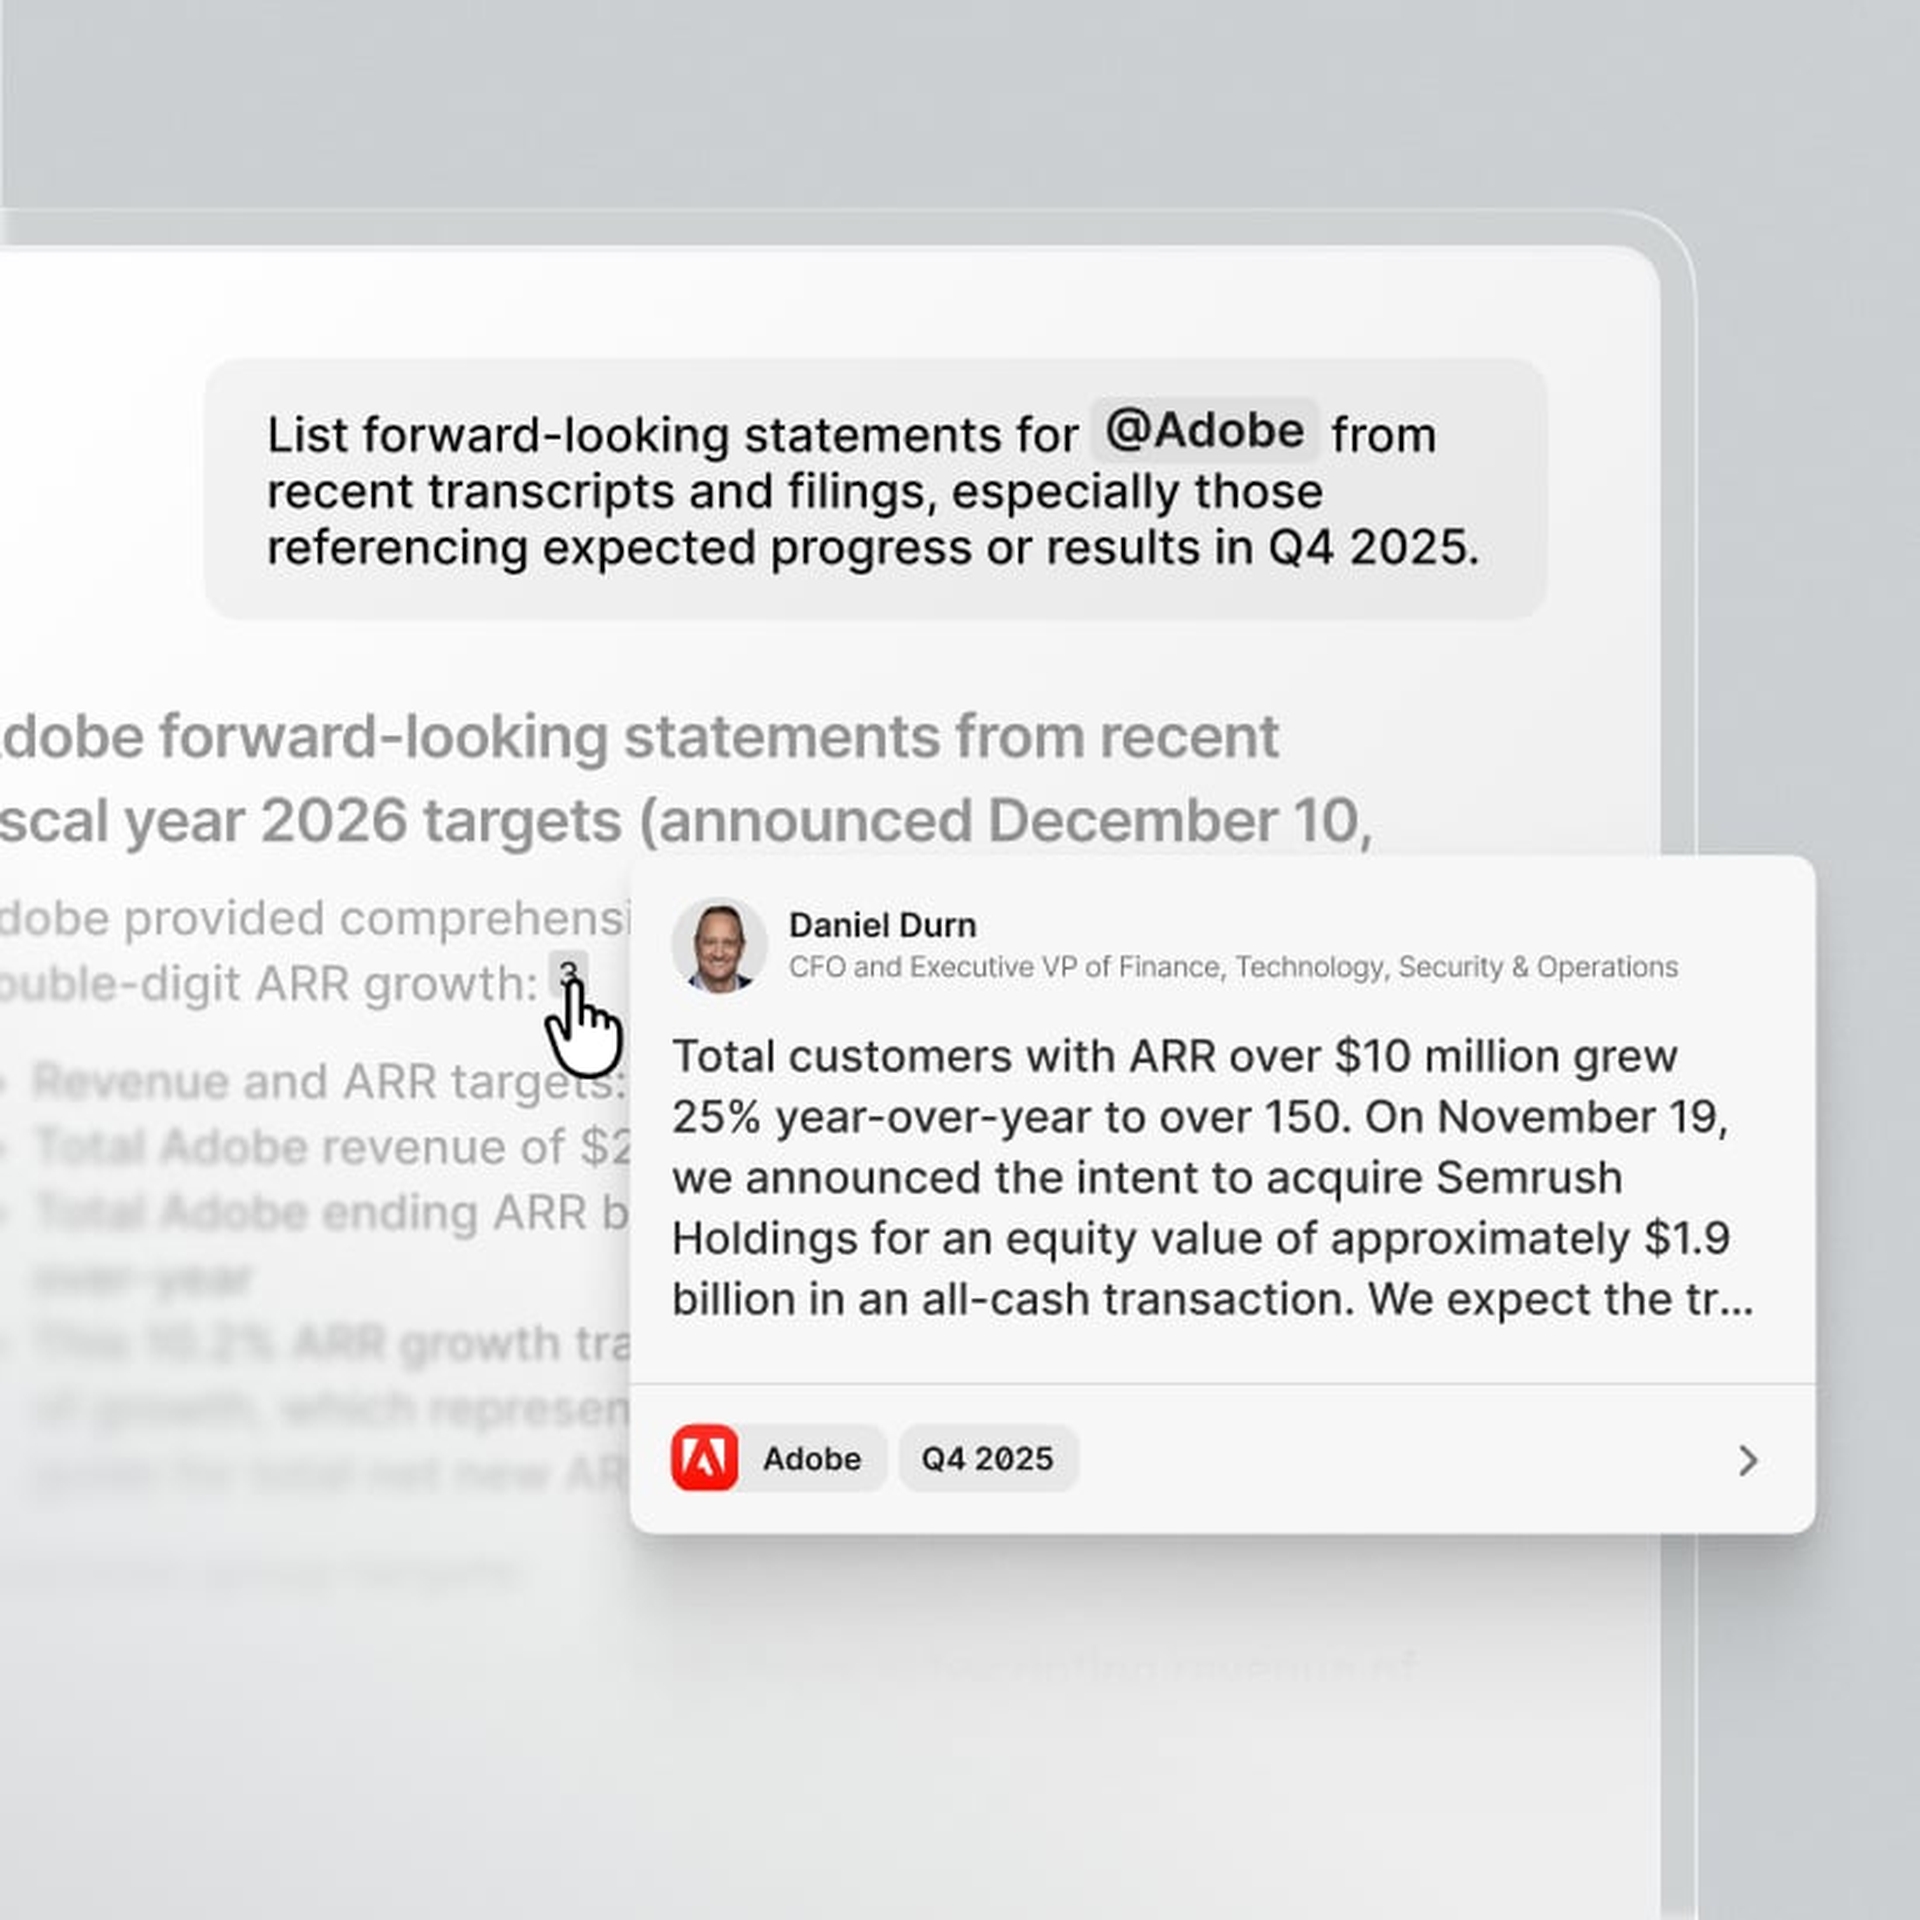
AI chat
Automations


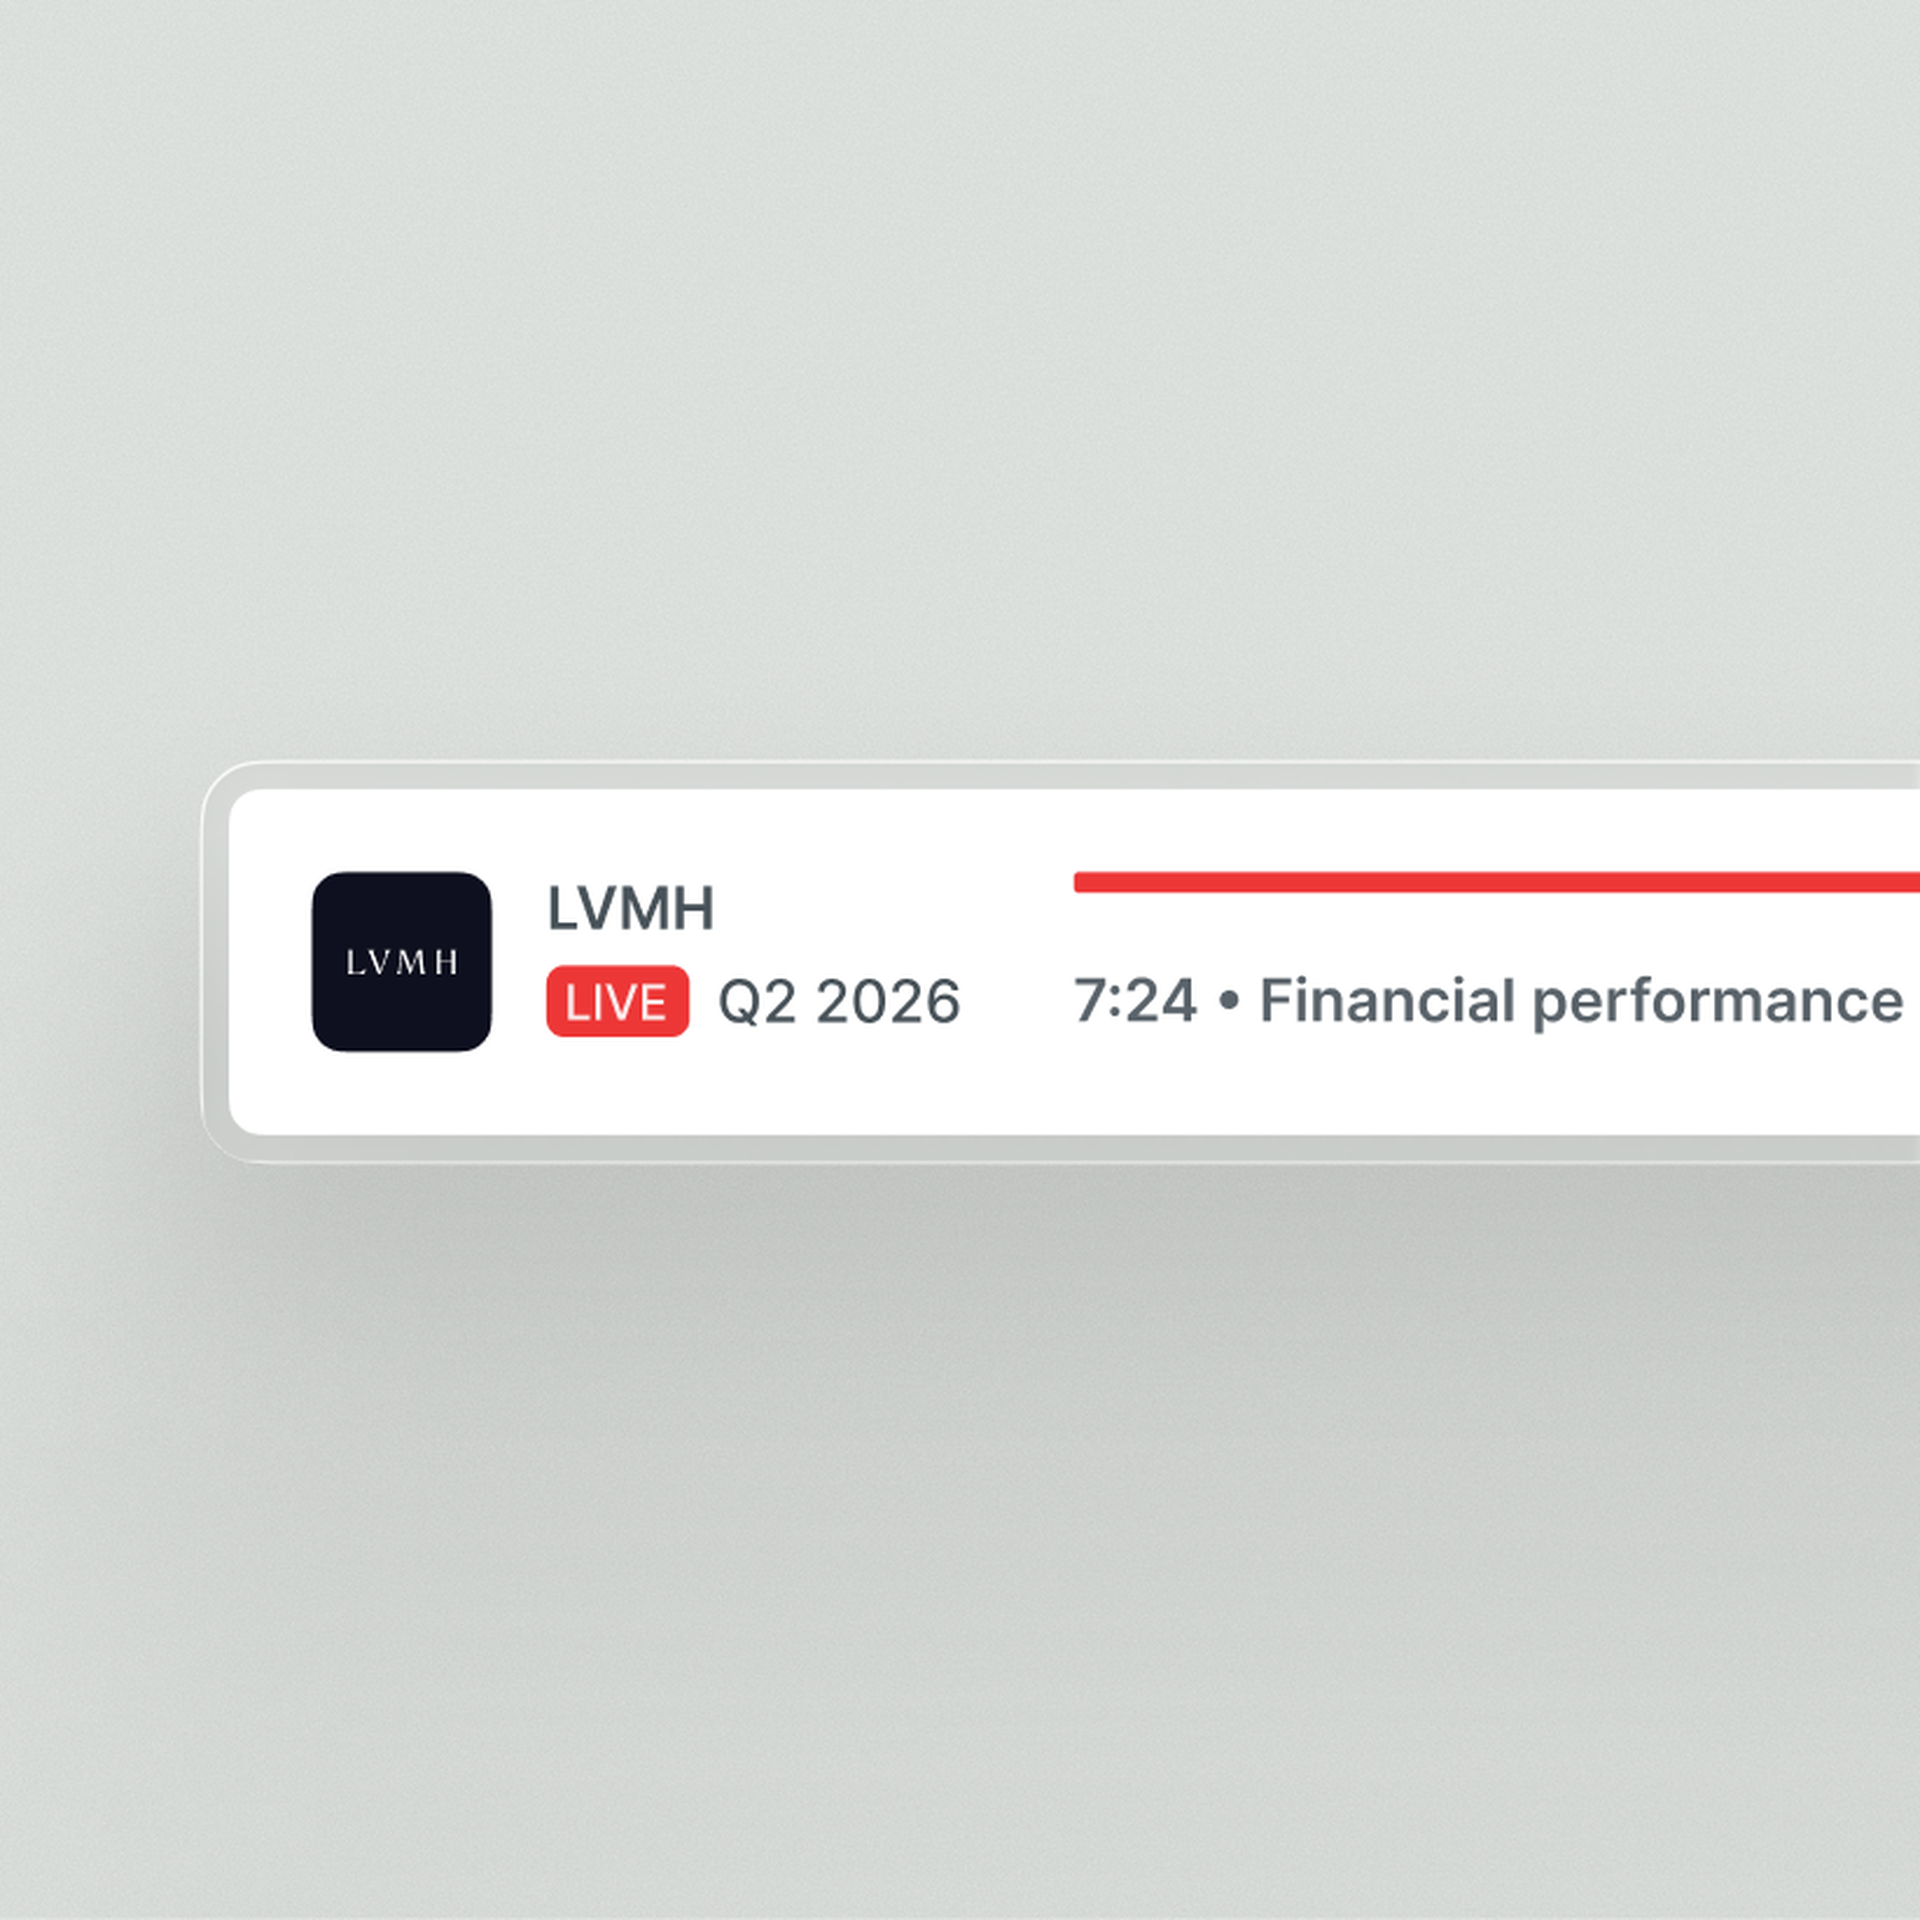
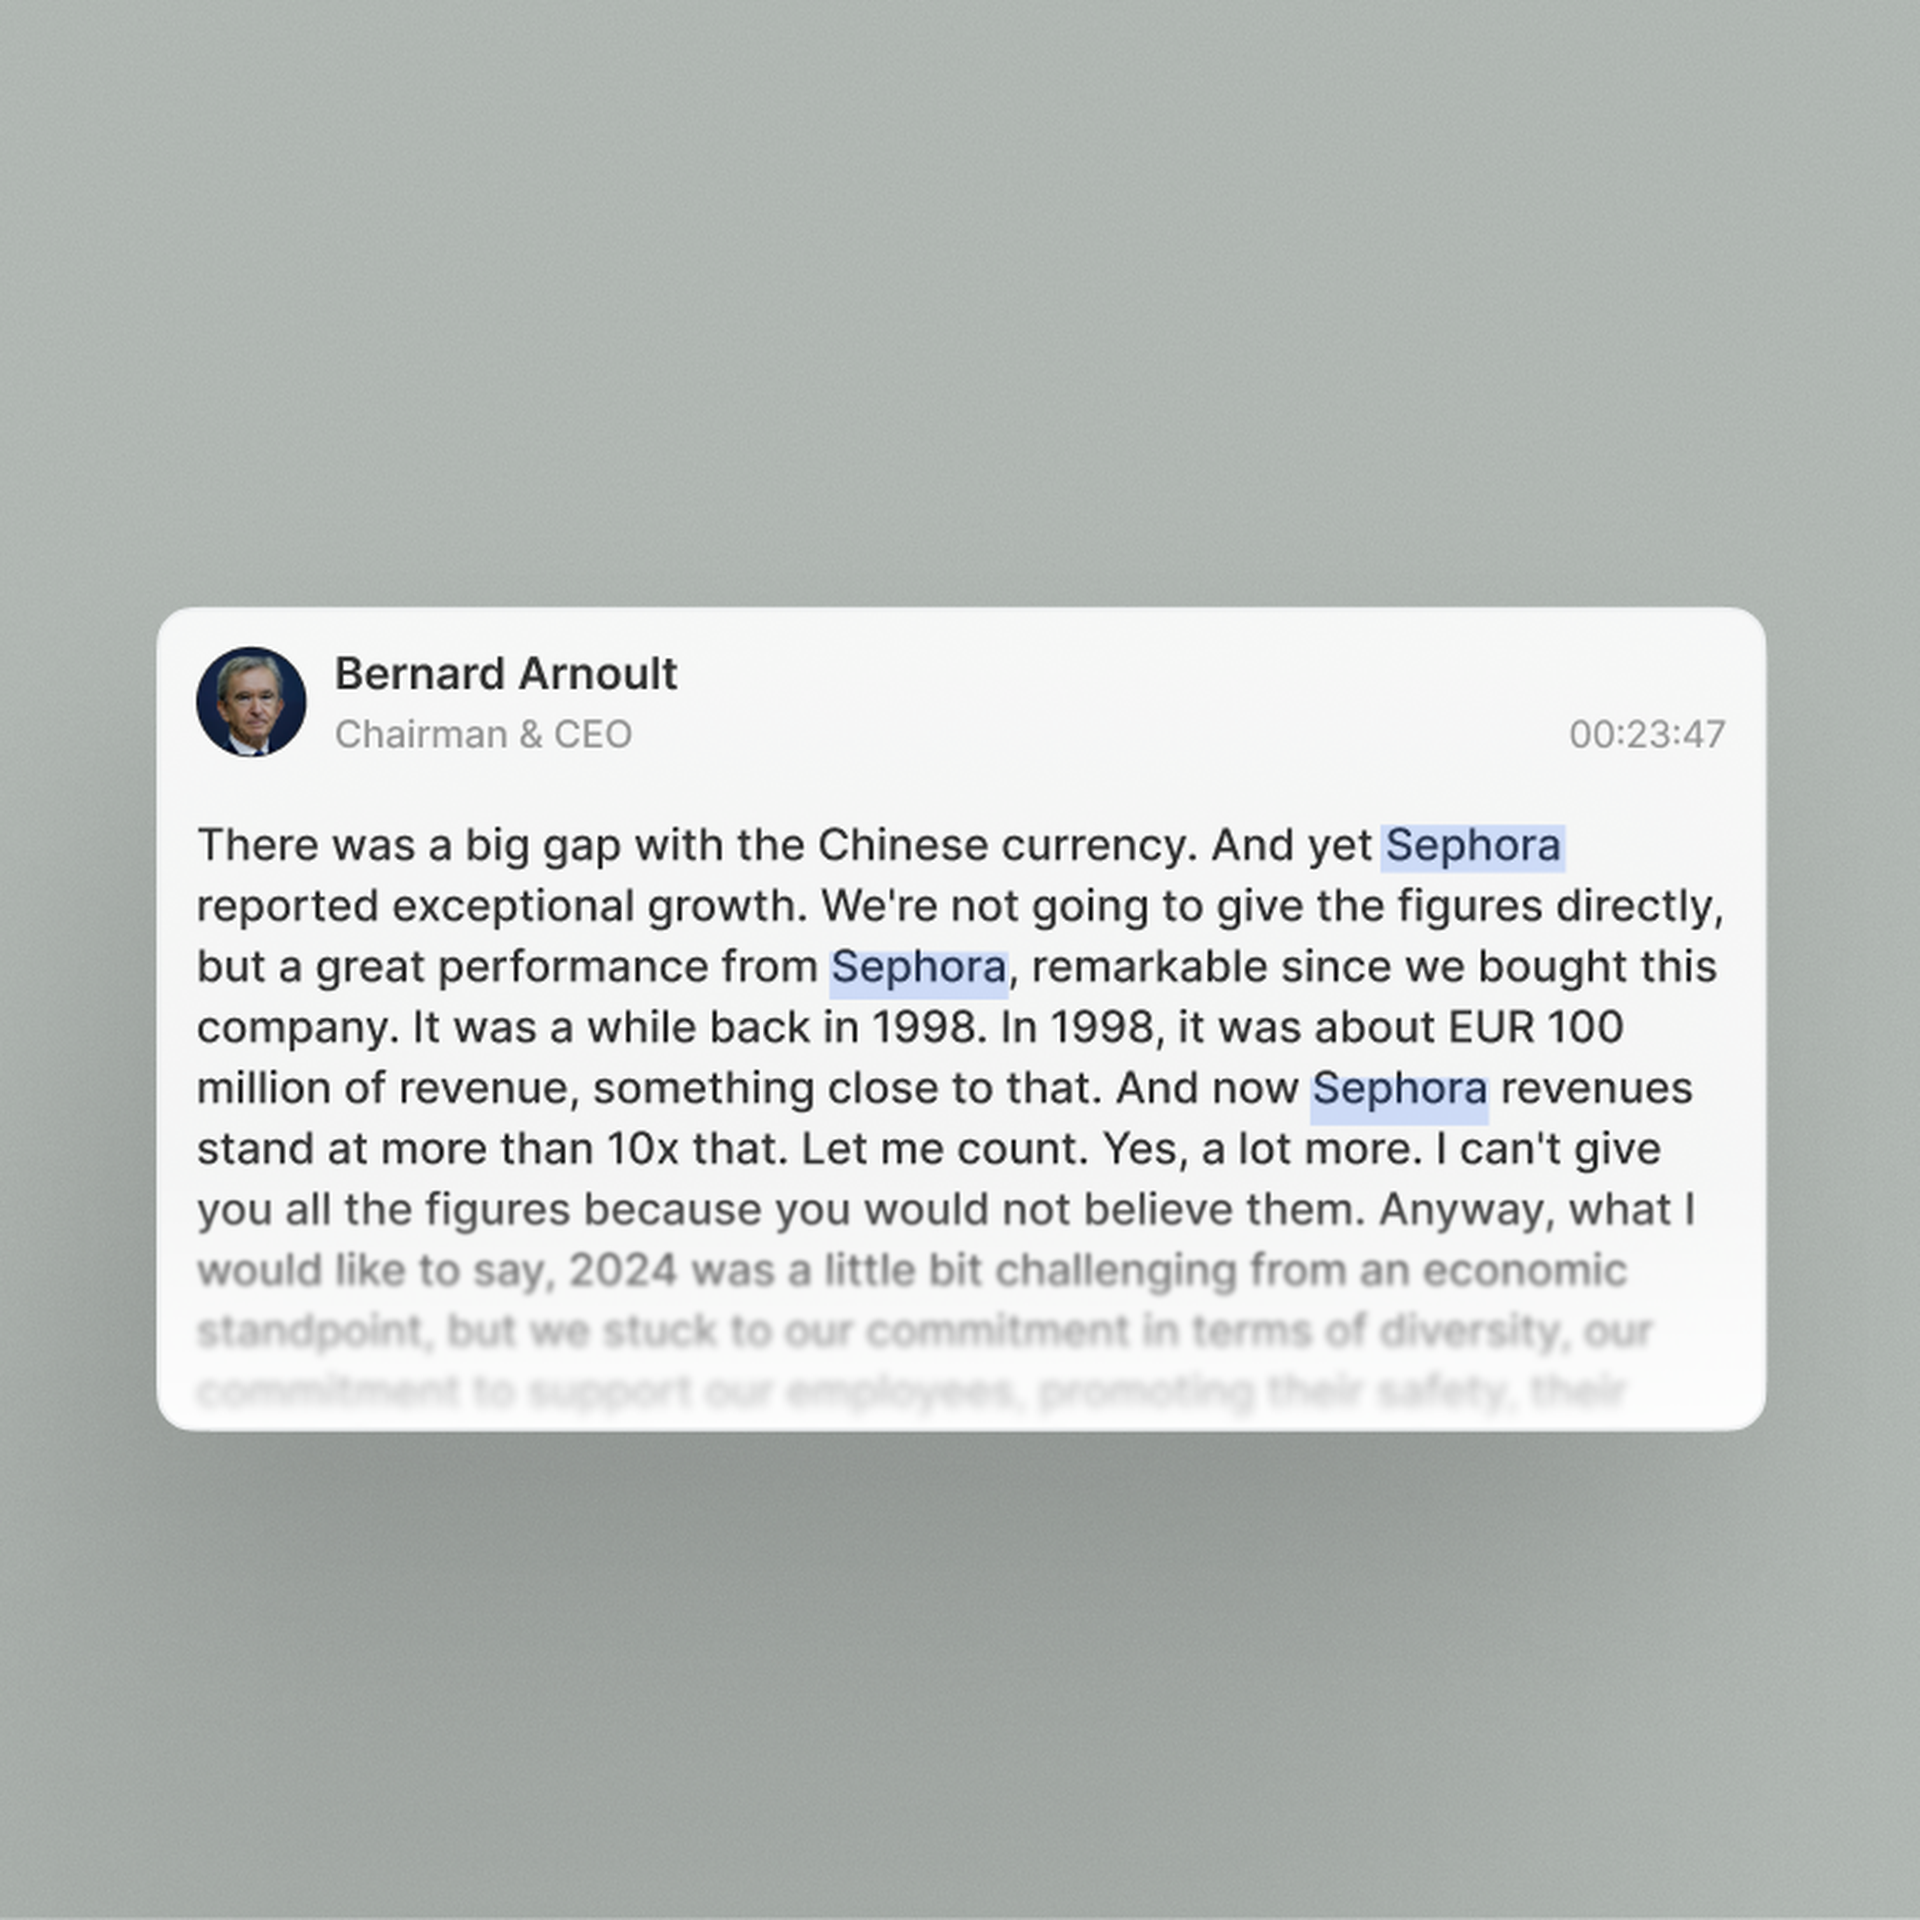
Live audio & transcripts
Quartr's AI stands out because it only pulls clean, first-party data from public companies. In investing, that's everything.
Jamie Ross
Investment Manager, GAM Investments
Research that used to take hours now takes seconds with Quartr Pro. Tracking shifts in tone or extracting tables, it's as simple as typing a query.
Tom O'Hara
Investment Director
Before Quartr we spent hours manually compiling insights through the peer earnings cycle. Now, these tasks are done faster, with greater precision.
Gregg Lampf
VP of Investor Relations
Being able to ask specific questions across years of transcripts and reports and instantly get verified answers is a game-changer.
Pontus Dackmo
CEO & Investment Manager