
Edge16 Oct 2026
Winner, Winner: The Chicken McNugget Story
How a 1940s breeding contest, a Cornell food scientist, and a hedge by Ray Dalio helped McDonald's turn the Chicken McNugget into a fast-food icon.

Q3 revenue reached a record $1.737B, up 13% YoY; reported net income rose 14% to $1.037B and adjusted net income was $1.084B.
Record Q3 ADV was 29.445M contracts, up 16% YoY across all six asset classes; quarter-end open interest reached 128.2M.
Adjusted operating income rose 15% to $1.206B; adjusted diluted EPS increased 13% to $3.02, versus reported diluted EPS of $2.89.
Clearing and transaction fee revenue was $1.378B, up 12%; market data revenue reached a record $243.1M, up 20%.
Adjusted expenses were $532M, including $428M excluding license fees; reported total expenses were $595.9M.
9M26 revenue rose 9% to $5.324B; adjusted diluted EPS increased 11% to $9.37 and reported net income rose 12% to $3.233B.
9M26 operating cash flow increased to $3.293B from $3.143B.
Through Oct. 20, Q4 ADV was 29.671M, up 17% YoY; 2026 YTD ADV was 31.643M, up 12%, and October ADV was tracking at a record level.
FY26 adjusted operating expense excluding license fees was expected to be ~$1.695B; capital expenditures net of leasehold improvement allowances ~$85M, with the adjusted tax rate at the low end of 23.5%-24.5%.
October fee changes were expected to add 0.5%-1% to clearing and transaction fees on a full-year basis at YTD26 activity; other fee and incentive changes were expected to lift revenue 1.0%-1.5% at 2025 activity levels.
Compute futures awaited regulatory review; the CFTC comment period was extended through Nov. 9, and decision timing remained uncertain.

AI chat

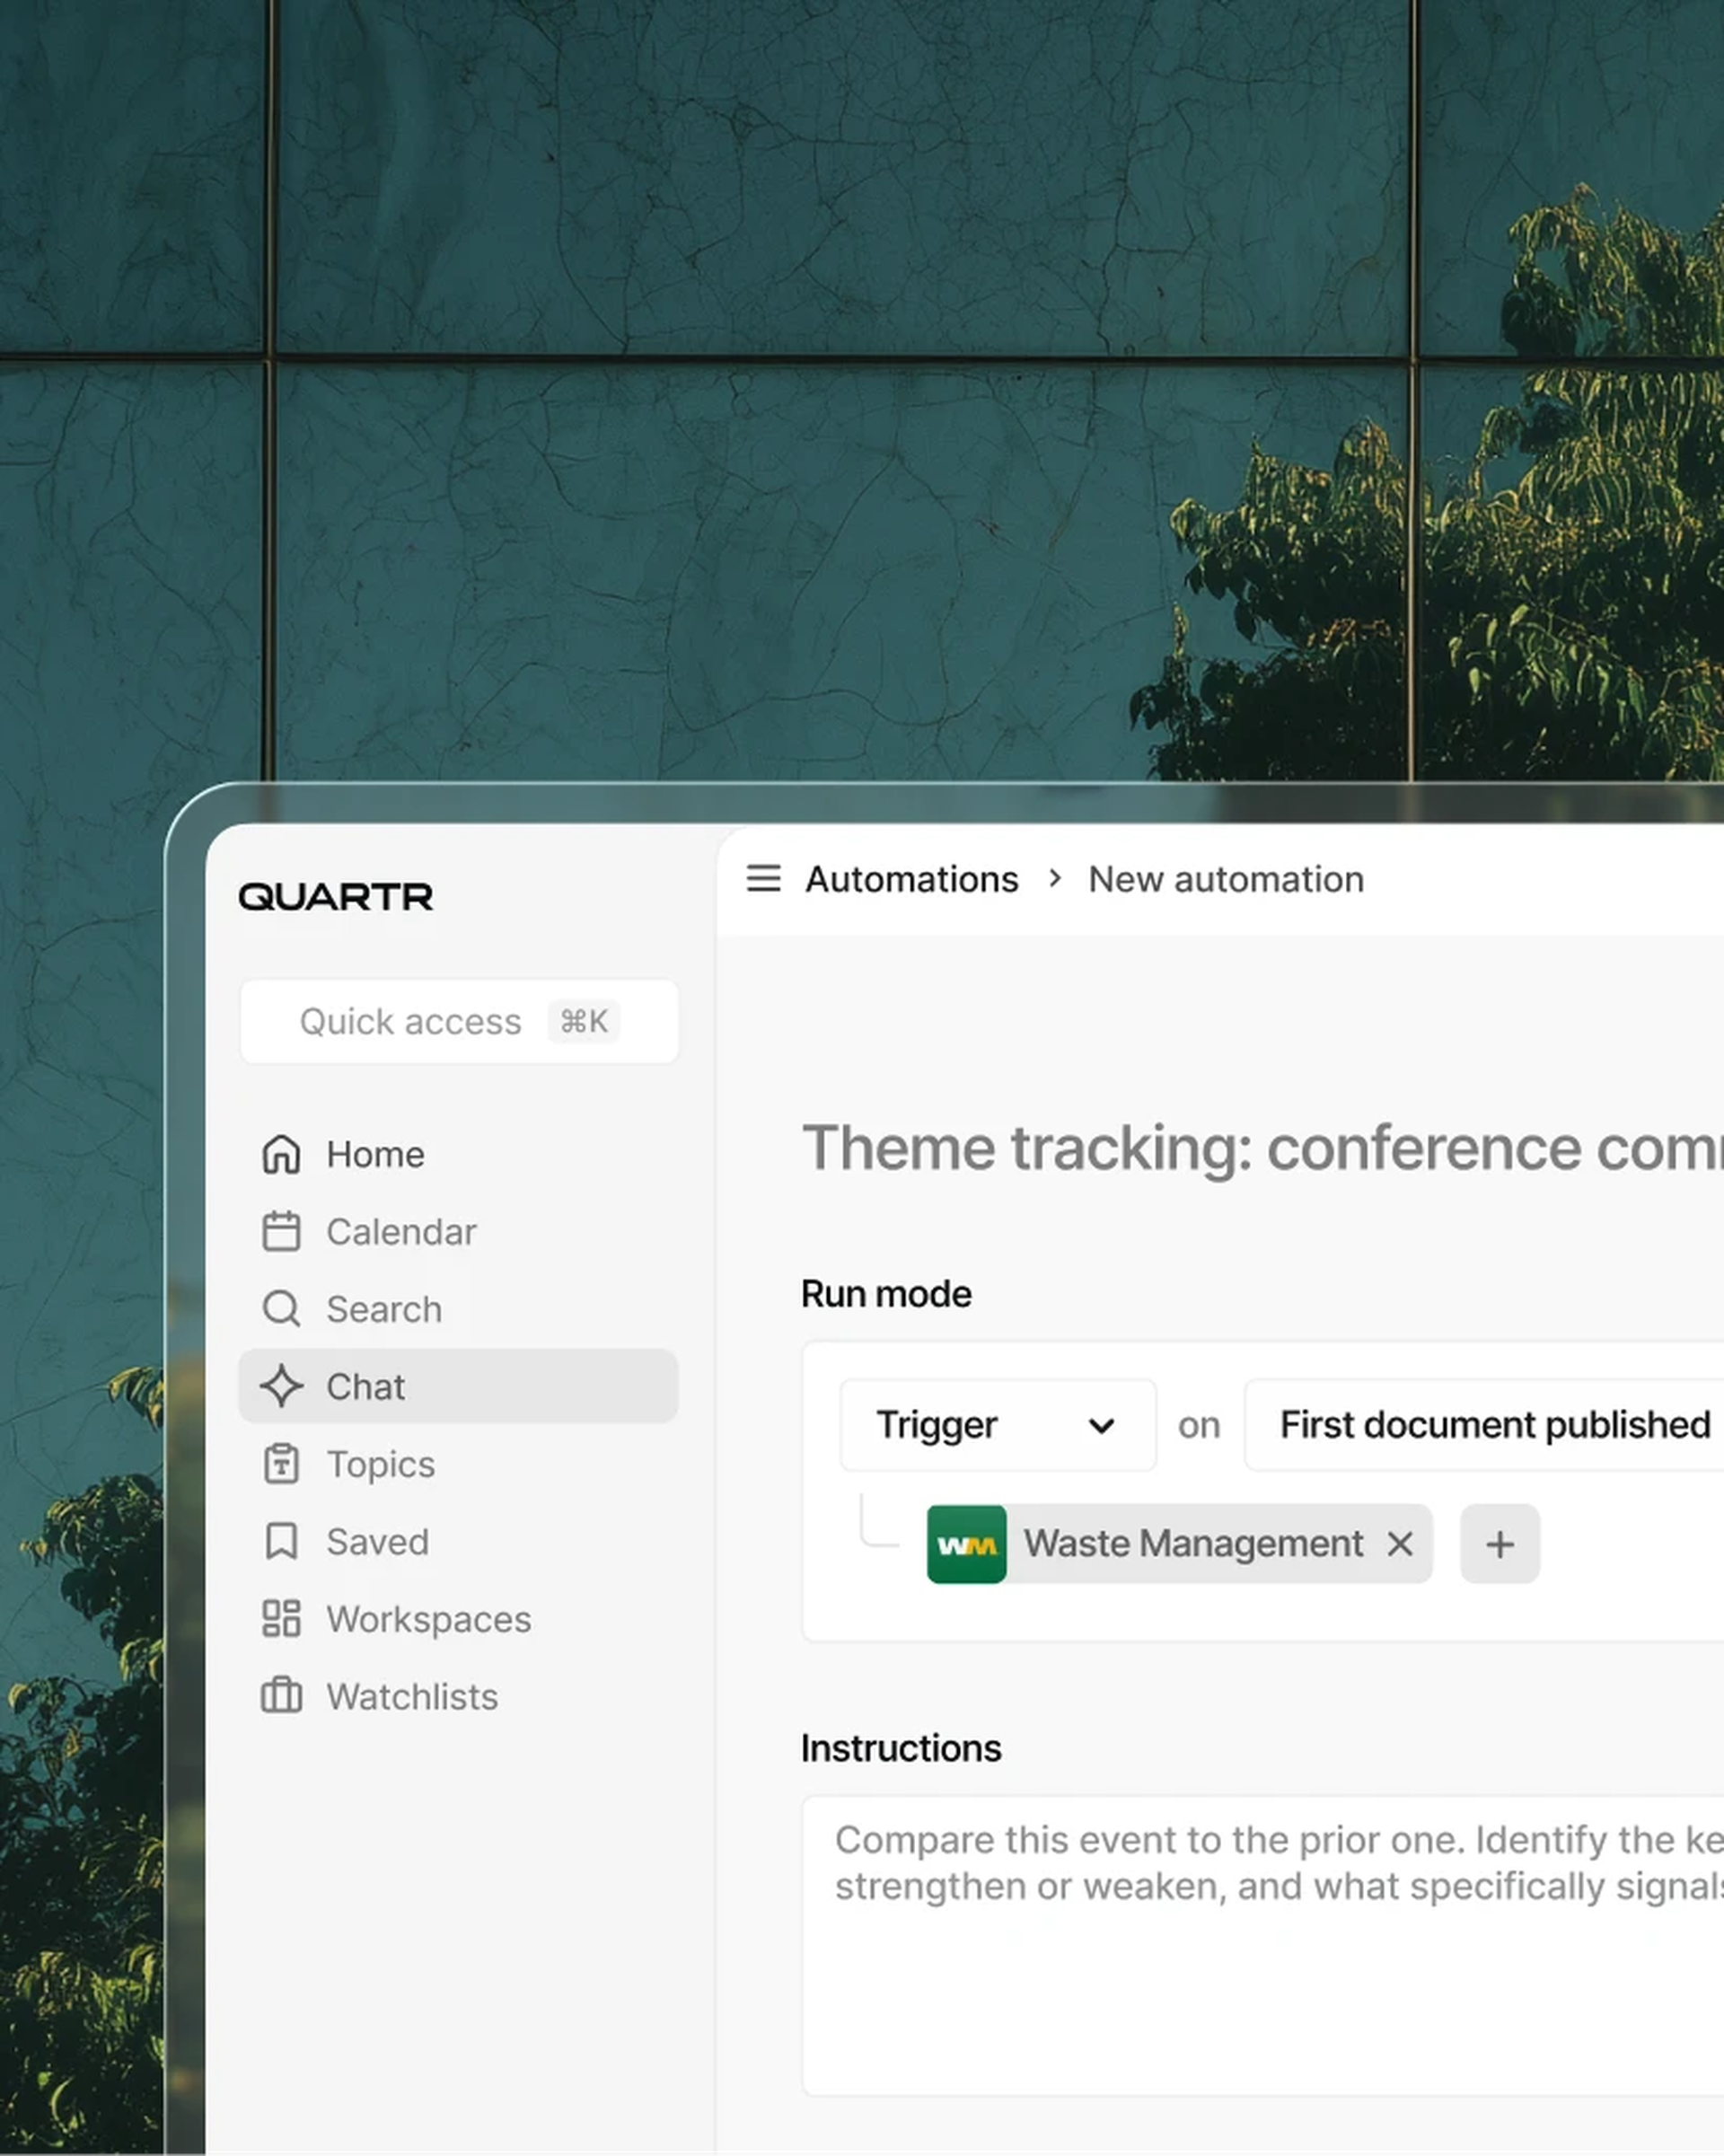
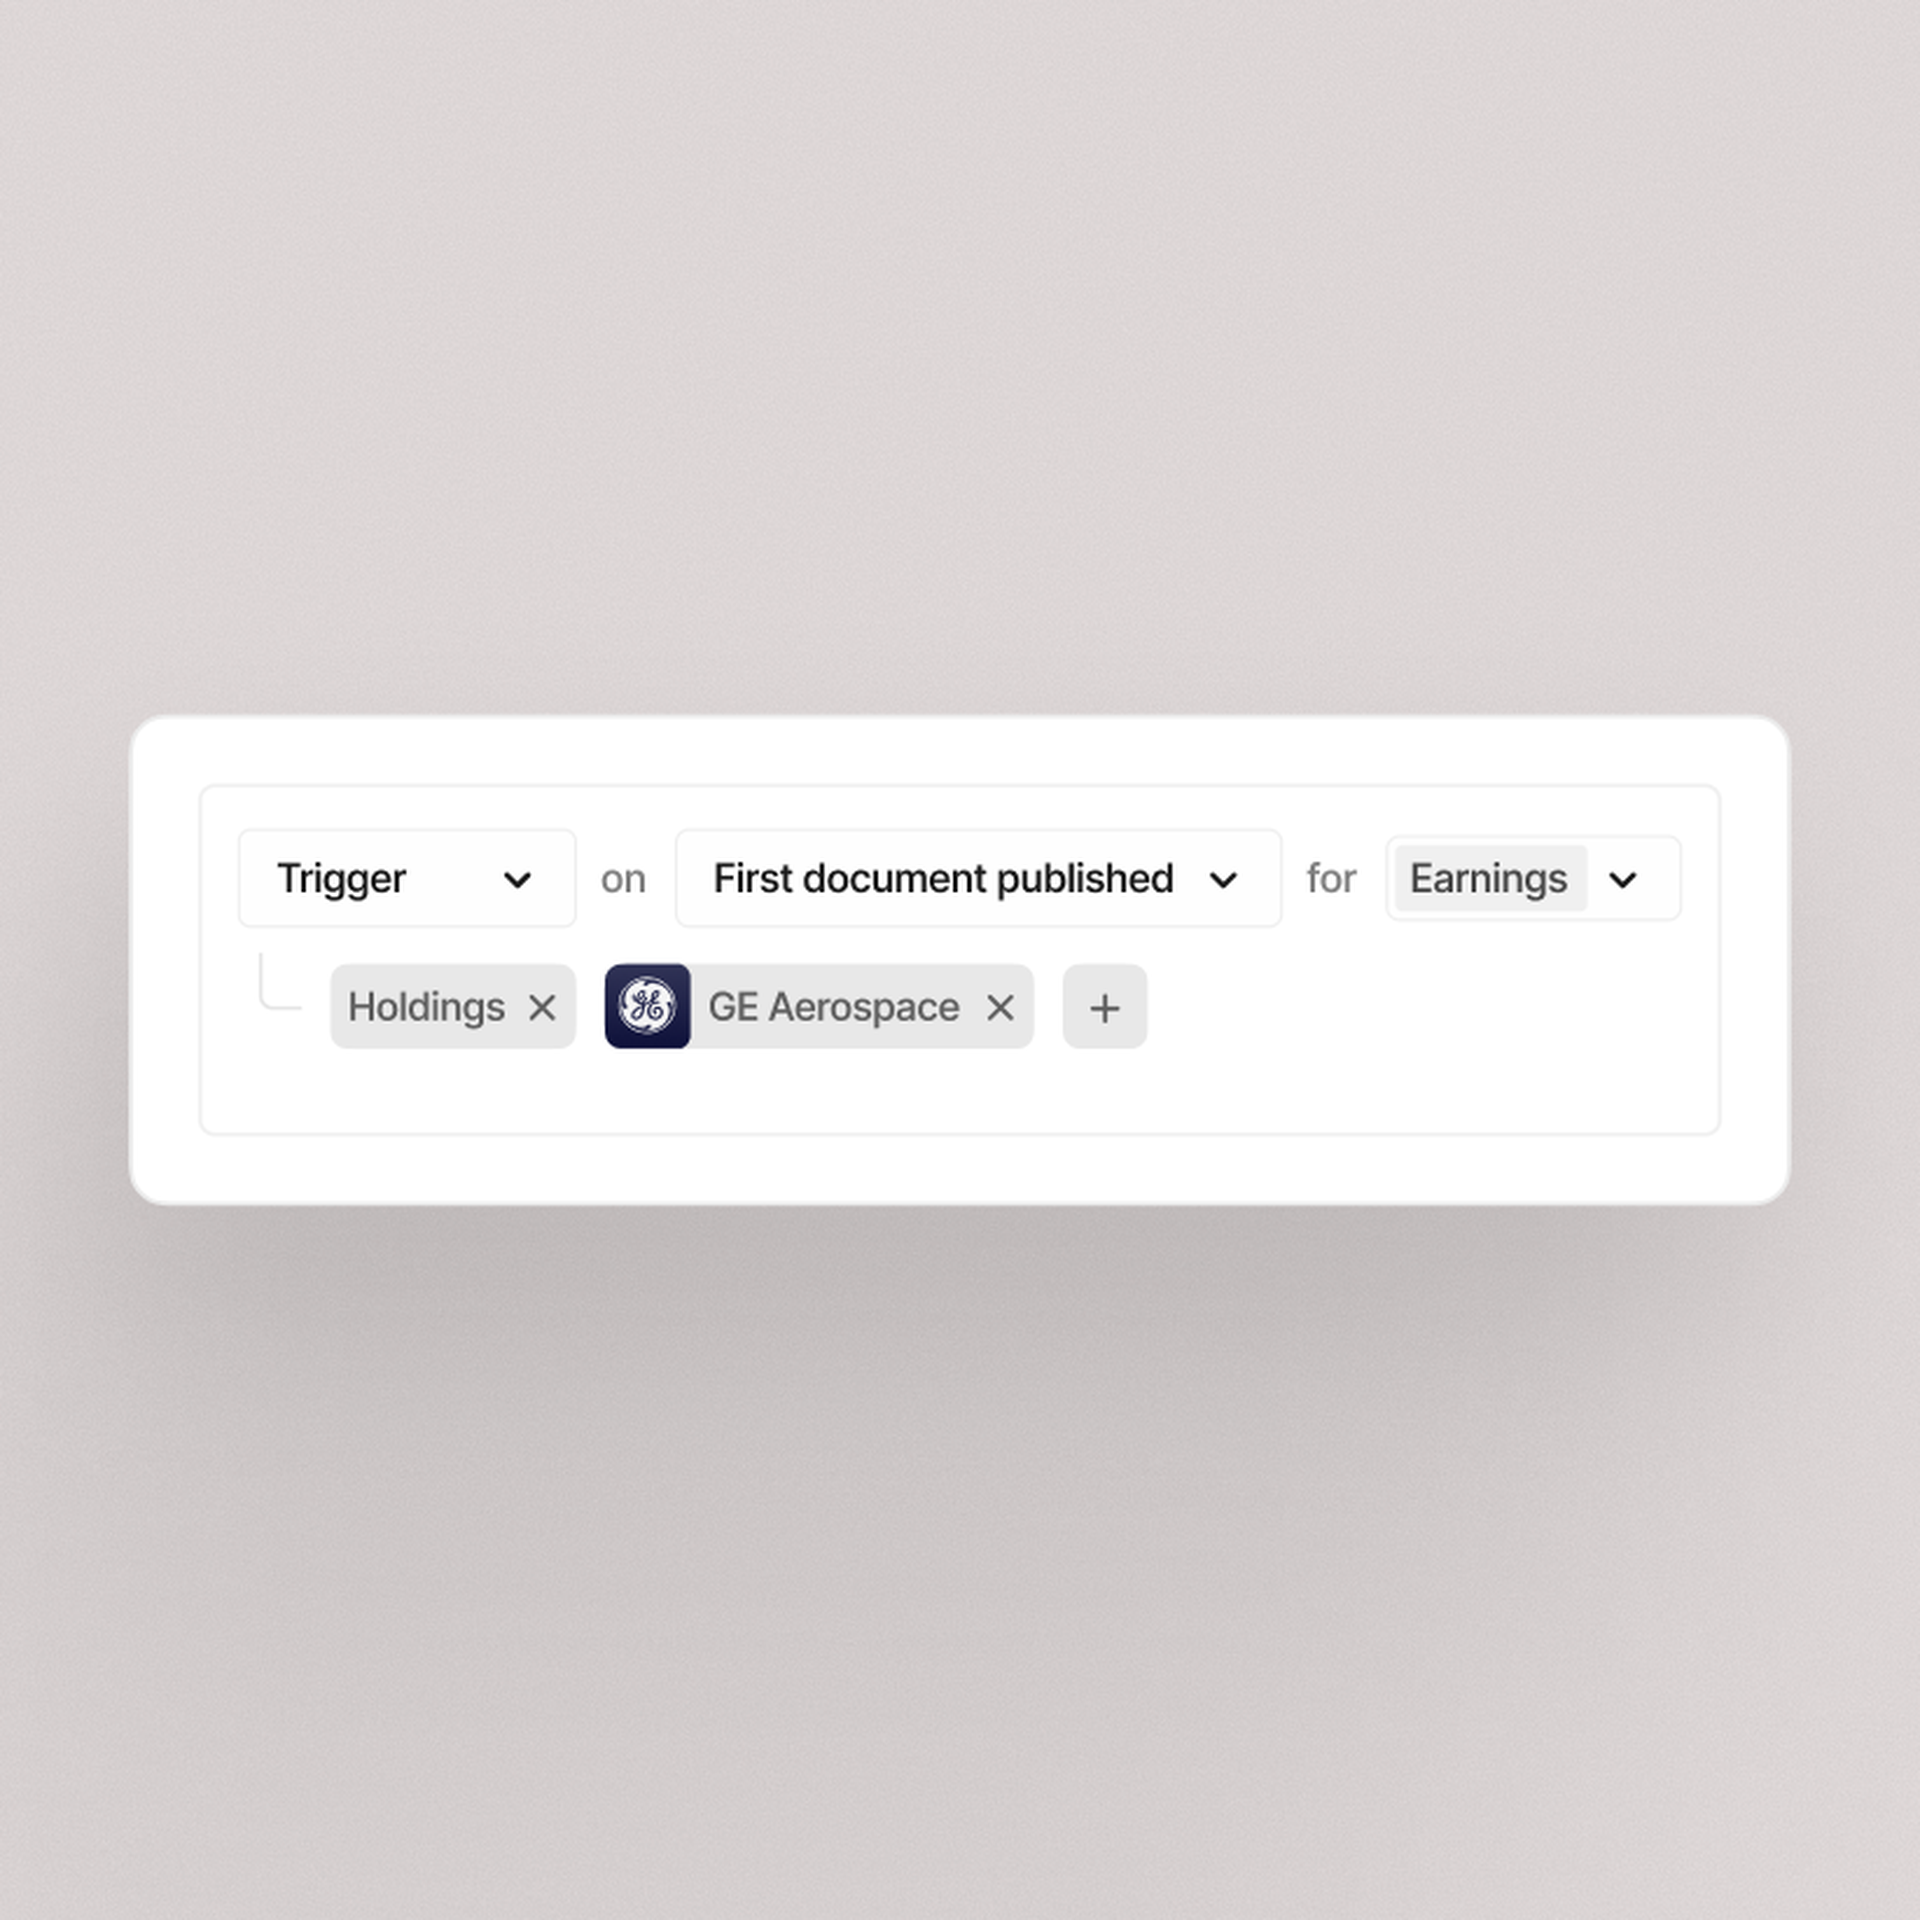
Automations

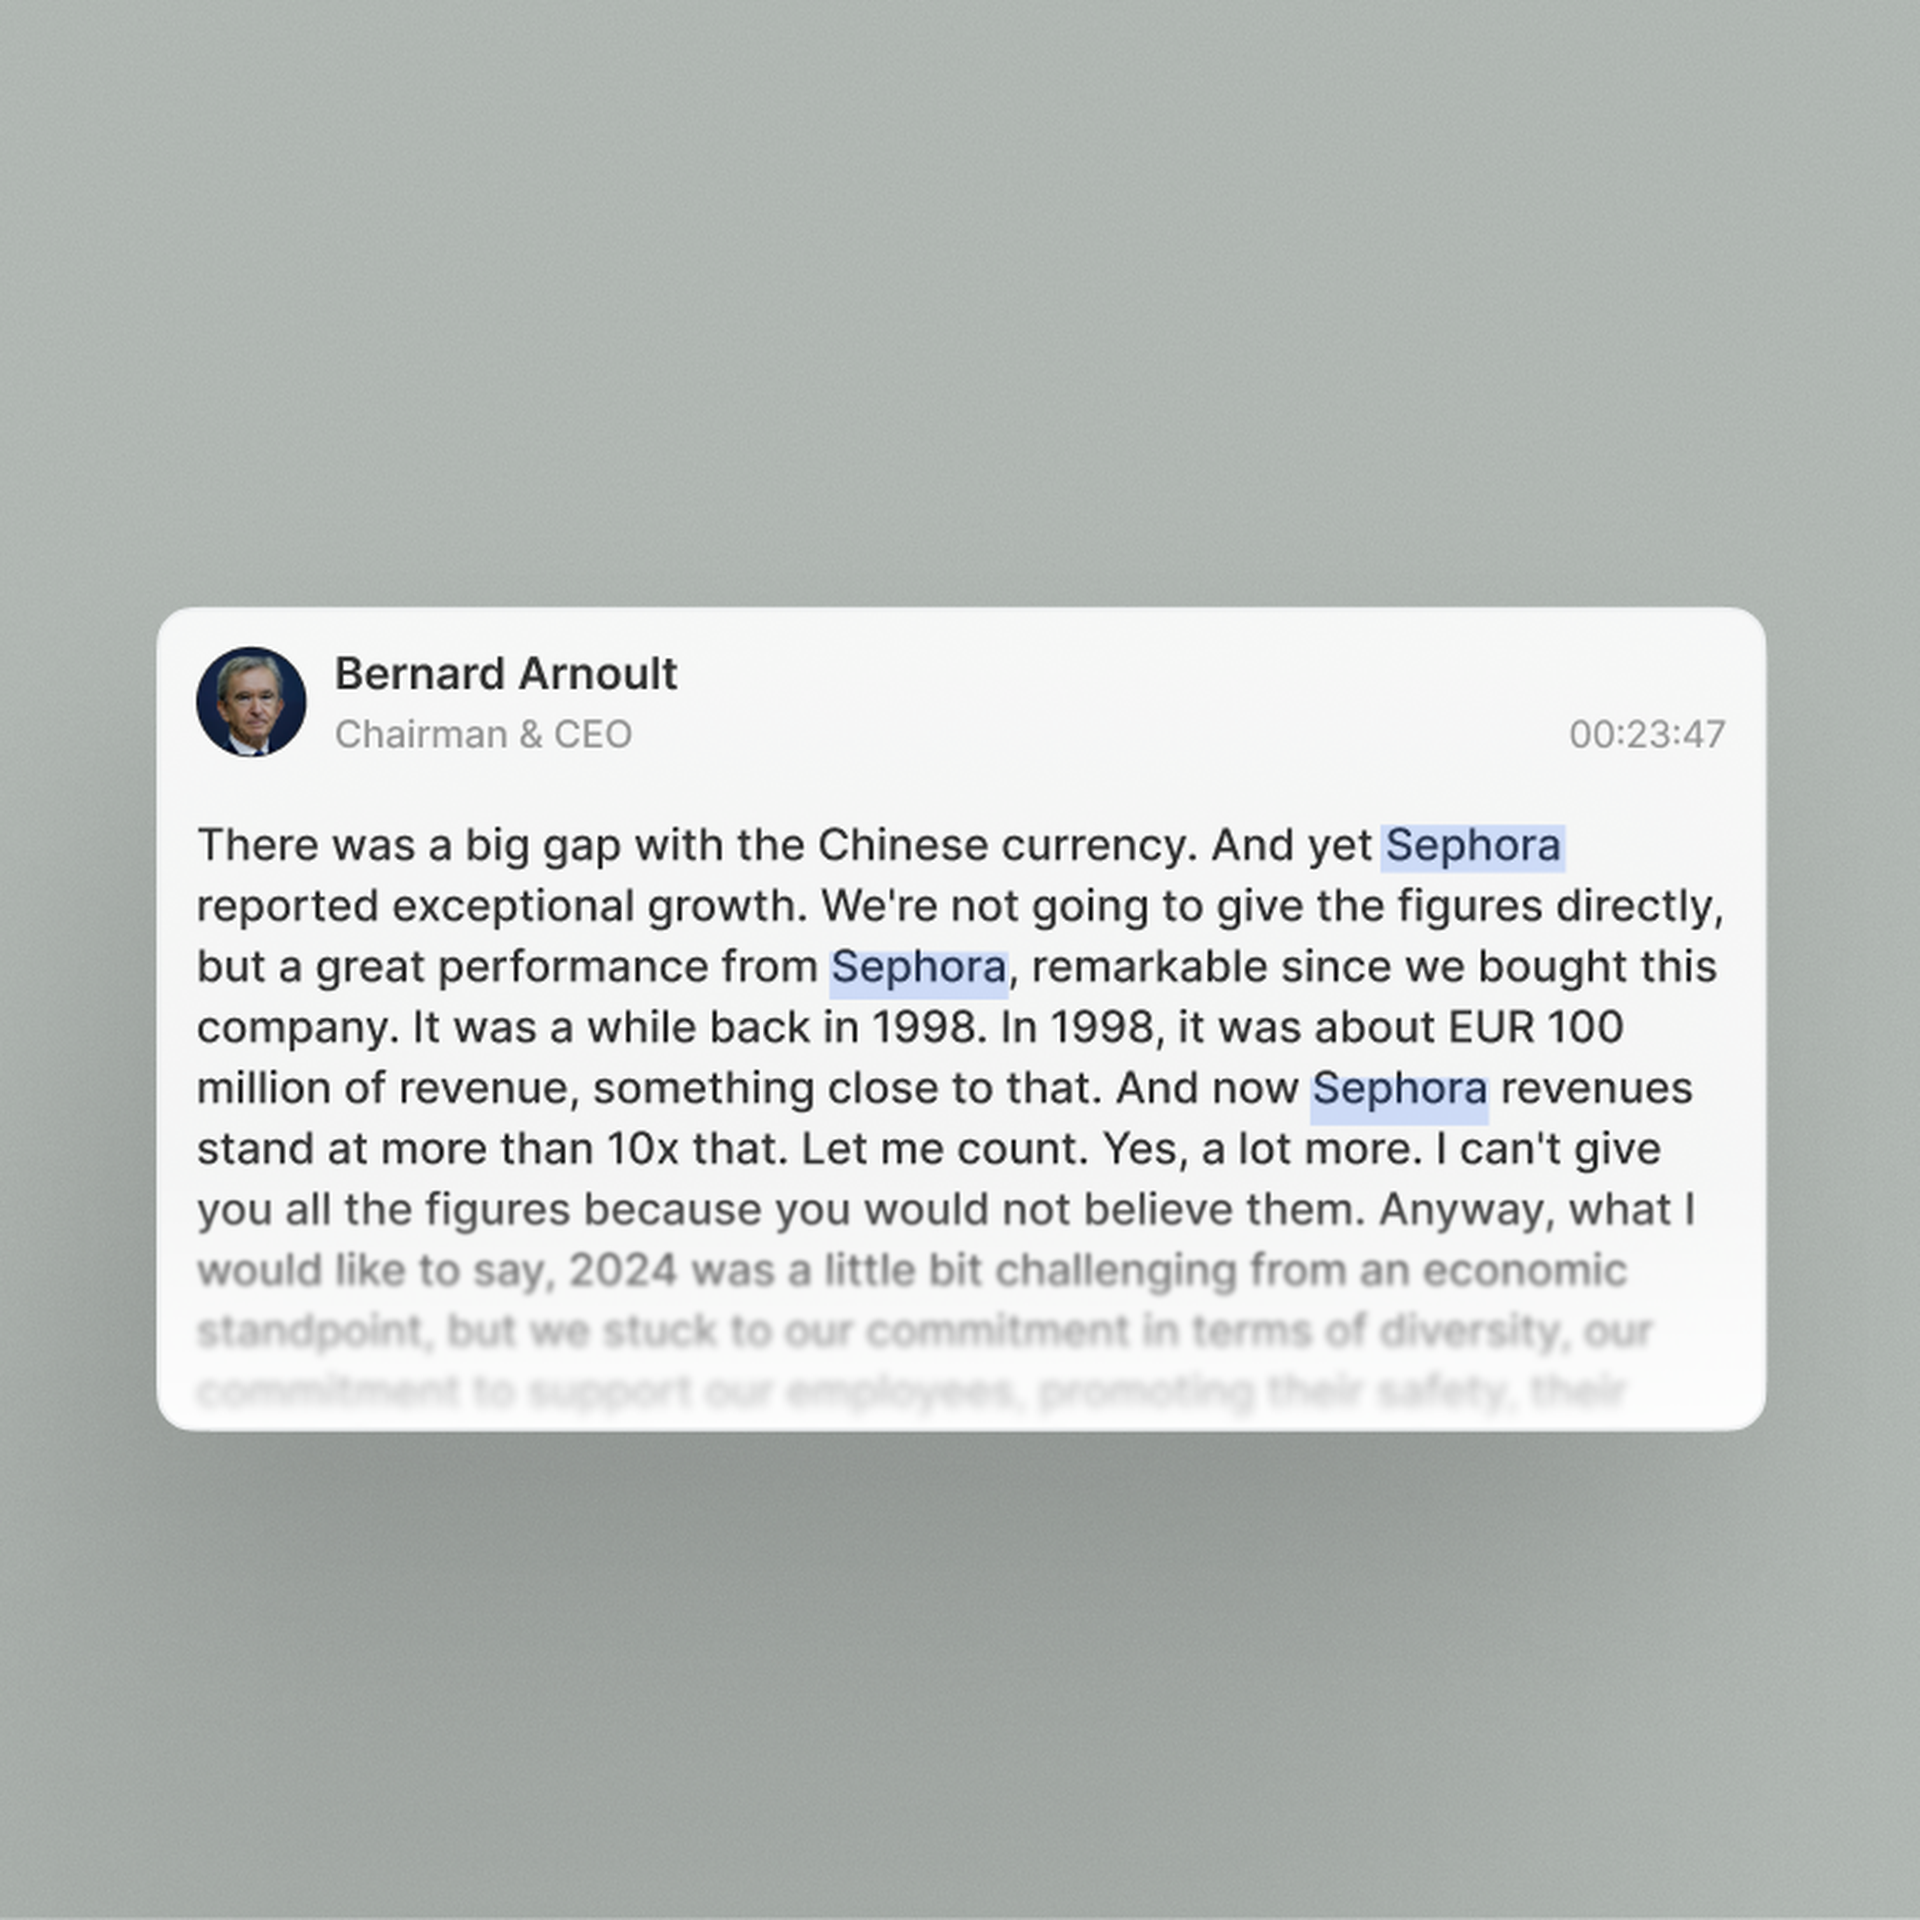
Live audio & transcripts
Quartr's AI stands out because it only pulls clean, first-party data from public companies. In investing, that's everything.
Jamie Ross
Investment Manager, GAM Investments
Research that used to take hours now takes seconds with Quartr Pro. Tracking shifts in tone or extracting tables, it's as simple as typing a query.
Tom O'Hara
Investment Director
Before Quartr we spent hours manually compiling insights through the peer earnings cycle. Now, these tasks are done faster, with greater precision.
Gregg Lampf
VP of Investor Relations
Being able to ask specific questions across years of transcripts and reports and instantly get verified answers is a game-changer.
Pontus Dackmo
CEO & Investment Manager
CME Group Inc. is an American company operating various financial derivatives exchanges. It owns and operates the Chicago Mercantile Exchange, Chicago Board of Trade, New York Mercantile Exchange, and The Commodity Exchange. It also has partial ownership and is one of the largest operators of financial derivatives in the world. Through its exchanges, the company enables trading in currencies, energy, commodities, options, futures, and more. The company is headquartered in Chicago and is traded on the Nasdaq.
The CME Group, originally known as the Chicago Mercantile Exchange, traces its origins back to 1898 when the Chicago Butter and Egg Board was established. In 1919, this organization was renamed the Chicago Mercantile Exchange (CME). Throughout the 20th century, the CME introduced various contracts, including frozen pork belly futures in the 1960s and the world’s first financial futures in the 1970s. In 2007, the Chicago Mercantile Exchange and the Chicago Board of Trade combined to form the CME Group, making it one of the world's largest derivatives exchange operators. The company continued its growth with the acquisition of the New York Mercantile Exchange in 2008 and the COMEX, further solidifying its position in the futures and options market. Today, the CME Group provides a platform for trading a diverse range of products including commodities, interest rates, equities, and foreign exchange contracts.
The CME Group-owned exchanges facilitate a vast array of trading activities spanning multiple asset classes. Commodities, both agricultural (like wheat, corn, and soybeans) and non-agricultural (such as gold, oil, and natural gas), form a significant portion of the traded contracts. Additionally, the exchanges offer a platform for financial derivatives, including interest rate futures, equity index futures, and foreign exchange contracts. Options on these futures contracts are also actively traded. Furthermore, the CME Group provides trading in alternative investment products, such as real estate and weather derivatives. These diverse offerings cater to a wide range of market participants, from hedgers trying to mitigate price risk to speculators aiming to profit from price fluctuations.
CME Group-owned exchanges complement traditional stock markets (like the ones operated by ICE and Nasdaq) by offering derivatives that provide risk management and hedging opportunities. While stock markets allow investors to buy and sell shares of individual companies, CME facilitates the trading of futures and options on assets like commodities, interest rates, and indexes. This allows investors to hedge against price fluctuations, protect their portfolios, and speculate on broad market movements without buying the underlying assets directly. Additionally, CME's 24-hour trading cycle provides continuous access, bridging time zones across global markets. In essence, while stock markets offer direct equity investments, CME Group provides tools for active trading, diversification, risk mitigation, and enhanced market accessibility.