Edge16 Oct 2026
Winner, Winner: The Chicken McNugget Story
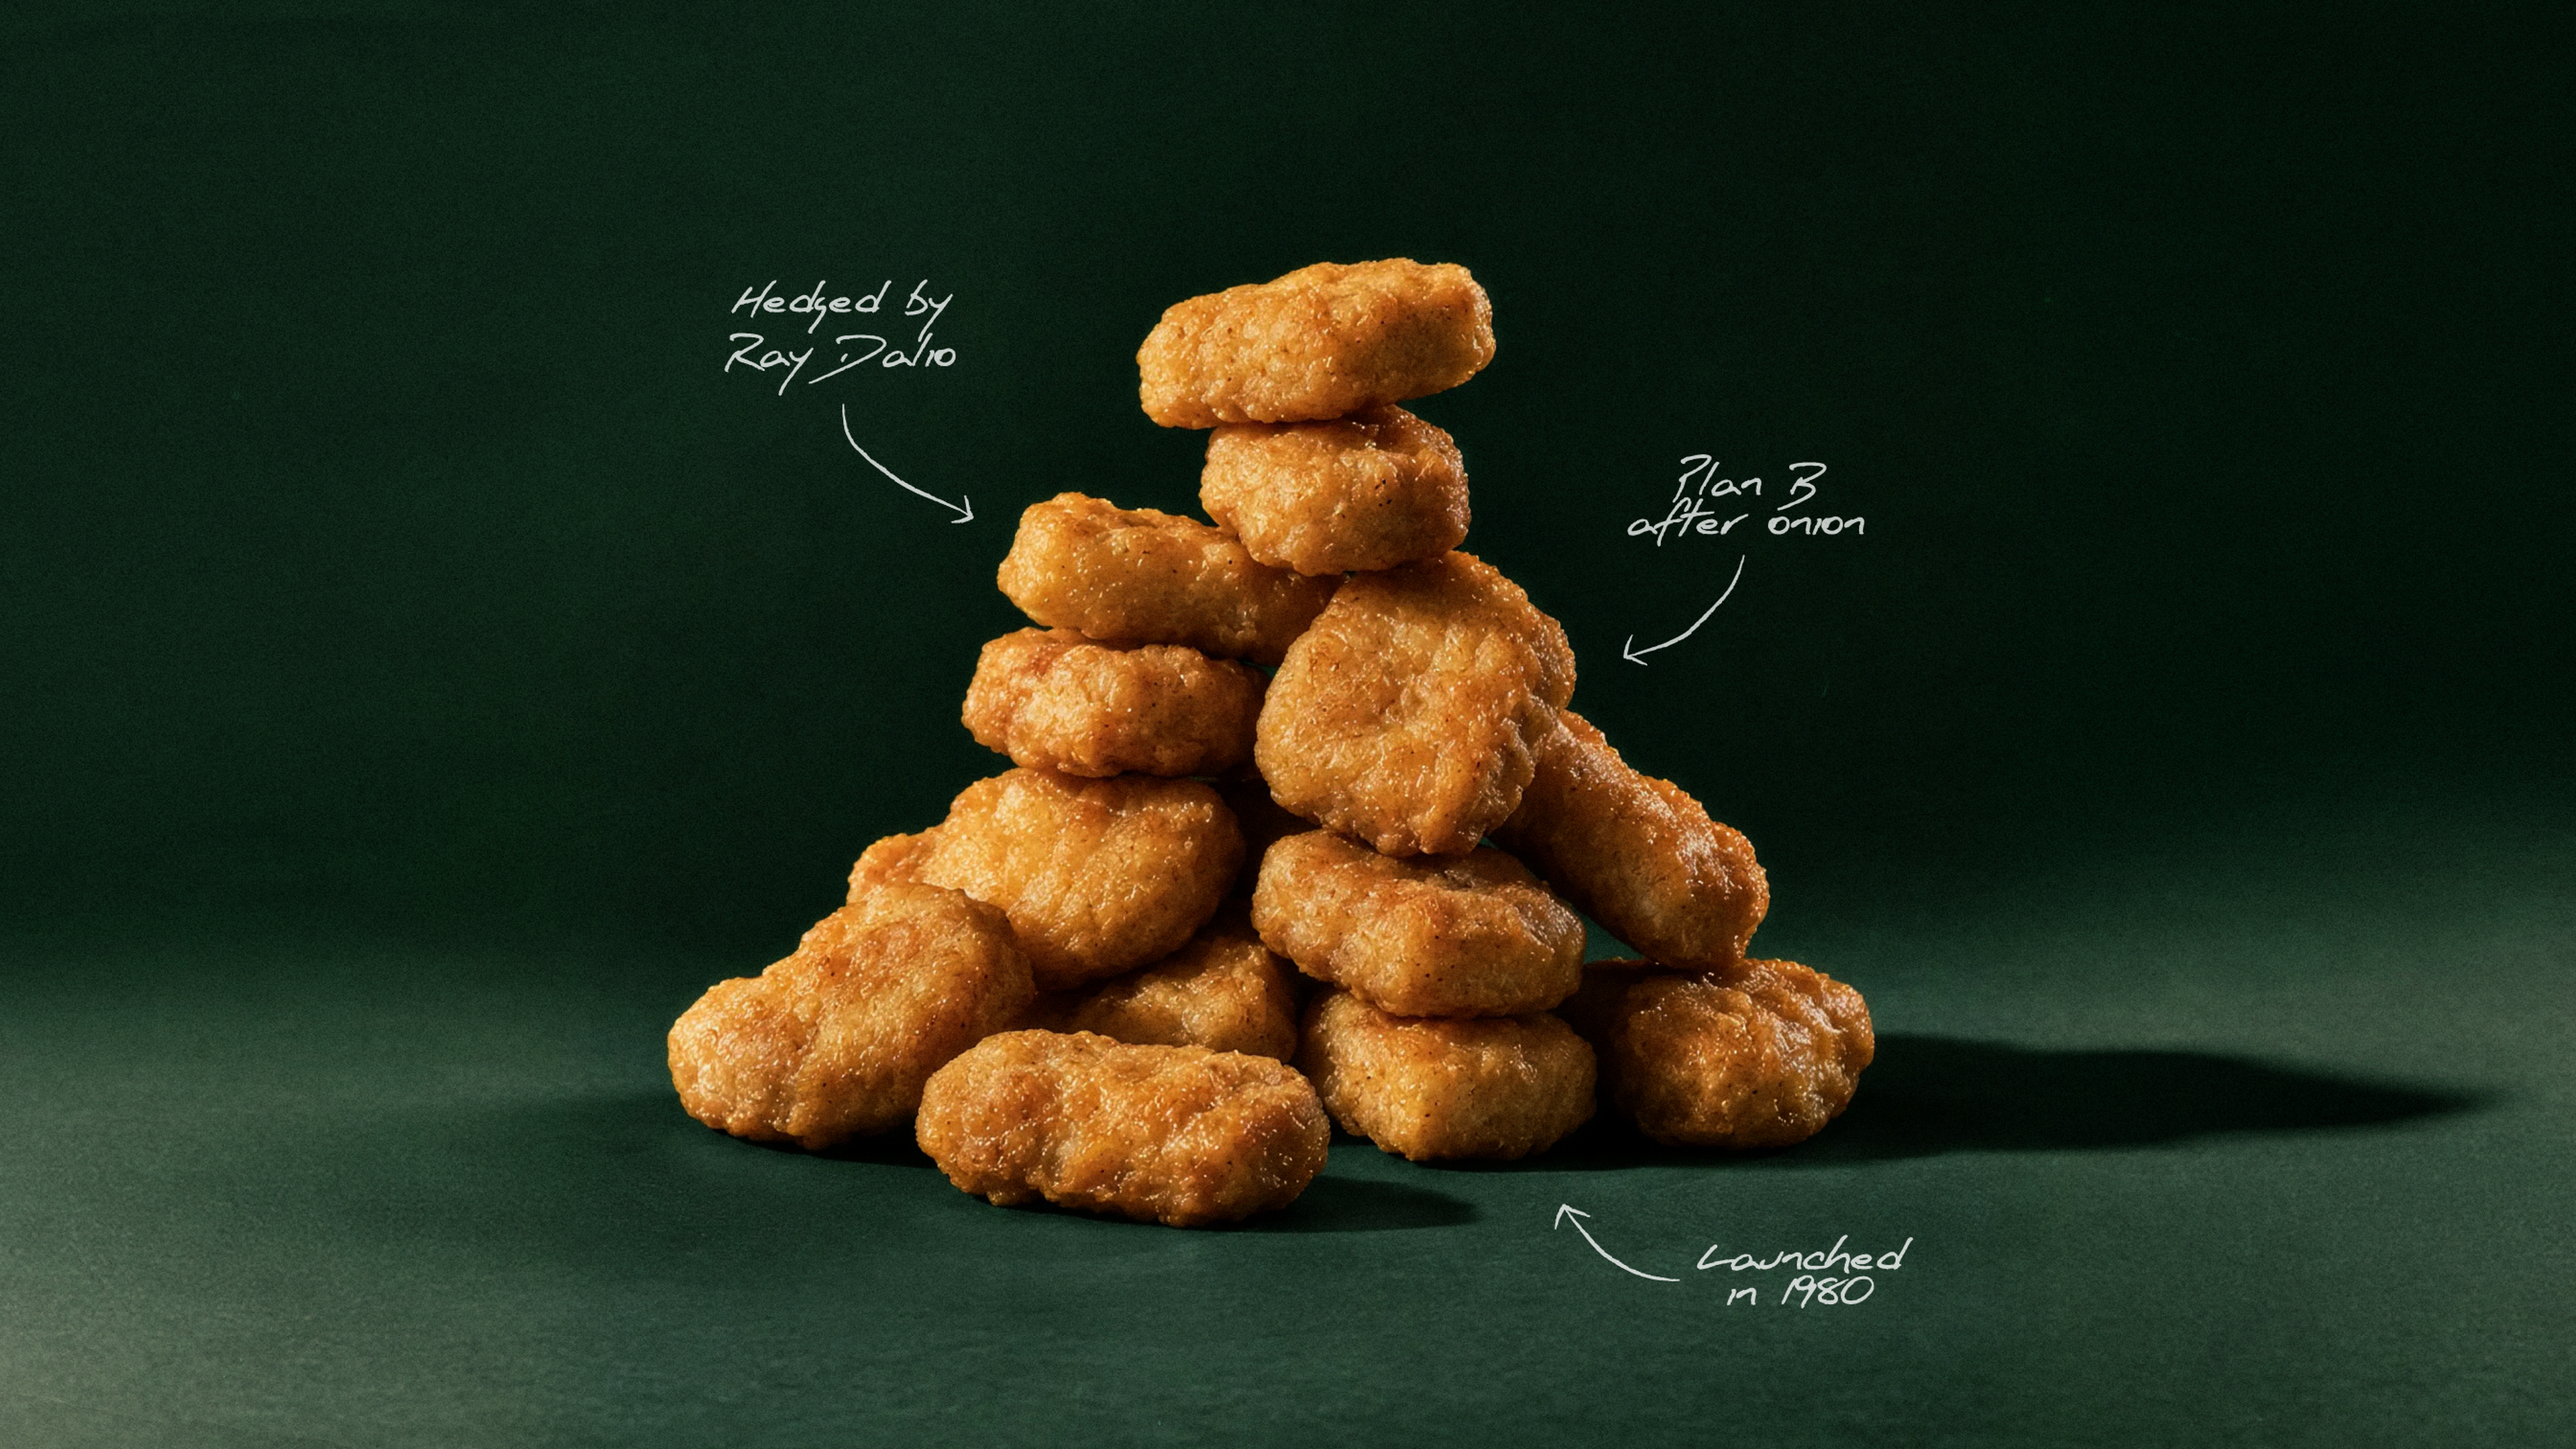
How a 1940s breeding contest, a Cornell food scientist, and a hedge by Ray Dalio helped McDonald's turn the Chicken McNugget into a fast-food icon.

Focused commercial banking model spans lending and deposit verticals, multiple geographies, and privately owned businesses; differentiation centers on client service, digital tools, and experienced leadership.
At 3Q26, total assets were $17.8B, deposits $15.1B, and loans $12.3B; market capitalization was $2.2B as of Oct. 22, 2026.
54-branch network averaged $203M in deposits per branch, excluding national deposit verticals; deposit and SBA loan production offices also extend the footprint nationally.
Midwest held 46% of deposits, Southwest 18%, West 8%, and deposit verticals 28%; deposit mix included DDA 33%, MMA and savings 31%, interest-bearing demand 25%, and CDs 11%.
Loan portfolio totaled $12.3B at 3Q26; C&I was 44% by product type, with CRE owner-occupied 20%, CRE interest-only 26%, construction 6%, residential 3%, and other 1%.
Specialty lending included $1.2B of SBA 7(a) loans, $1.4B of life insurance premium finance loans, $714M of sponsor finance loans, and $750M of tax-credit loans outstanding.
Deposit verticals included $1.8B in property management deposits, $1.5B in community association deposits, and $901M in legal industry and escrow deposits.
10-year CAGRs through 3Q26 were 15.0% for loans and 17.1% for deposits; stated growth priorities include Southwest and West markets and mid- to high-single-digit annual balance-sheet growth.
From 2021 through 3Q26, 42 producers were hired to add density and capability in focus geographies; 13 Phoenix and 4 Kansas hires were tied to branch acquisitions.
3Q26 YTD PPNR was $213M and PPNR ROAA was 1.63%; 2025 full-year figures were $255M and 1.70%, respectively.
Net interest margin was 4.29% for 3Q26 YTD, versus 3.41% in 2021; the presentation characterized 3Q26 performance as top quartile.
3Q26 capital and liquidity metrics included $7.1B available liquidity, 11.1% CET1, 8.13% TCE, and 63% adjustable-rate loans; adjusted ROATCE was 11.4% YTD.
Nine-month 2026 ROATCE was 11.22% and adjusted ROATCE 11.44%; CET1 was 11.1% GAAP and 9.2% excluding unrealized securities losses.
Capital priorities include maintaining 8–9% TCE, regular dividend increases, active share repurchases, and flexibility for organic growth and M&A; $34.0M was returned through repurchases in 3Q26.

AI chat

Automations


Live audio & transcripts

Quartr's AI stands out because it only pulls clean, first-party data from public companies. In investing, that's everything.
Jamie Ross
Investment Manager, GAM Investments
Research that used to take hours now takes seconds with Quartr Pro. Tracking shifts in tone or extracting tables, it's as simple as typing a query.
Tom O'Hara
Investment Director
Before Quartr we spent hours manually compiling insights through the peer earnings cycle. Now, these tasks are done faster, with greater precision.
Gregg Lampf
VP of Investor Relations
Being able to ask specific questions across years of transcripts and reports and instantly get verified answers is a game-changer.
Pontus Dackmo
CEO & Investment Manager