Edge16 Oct 2026
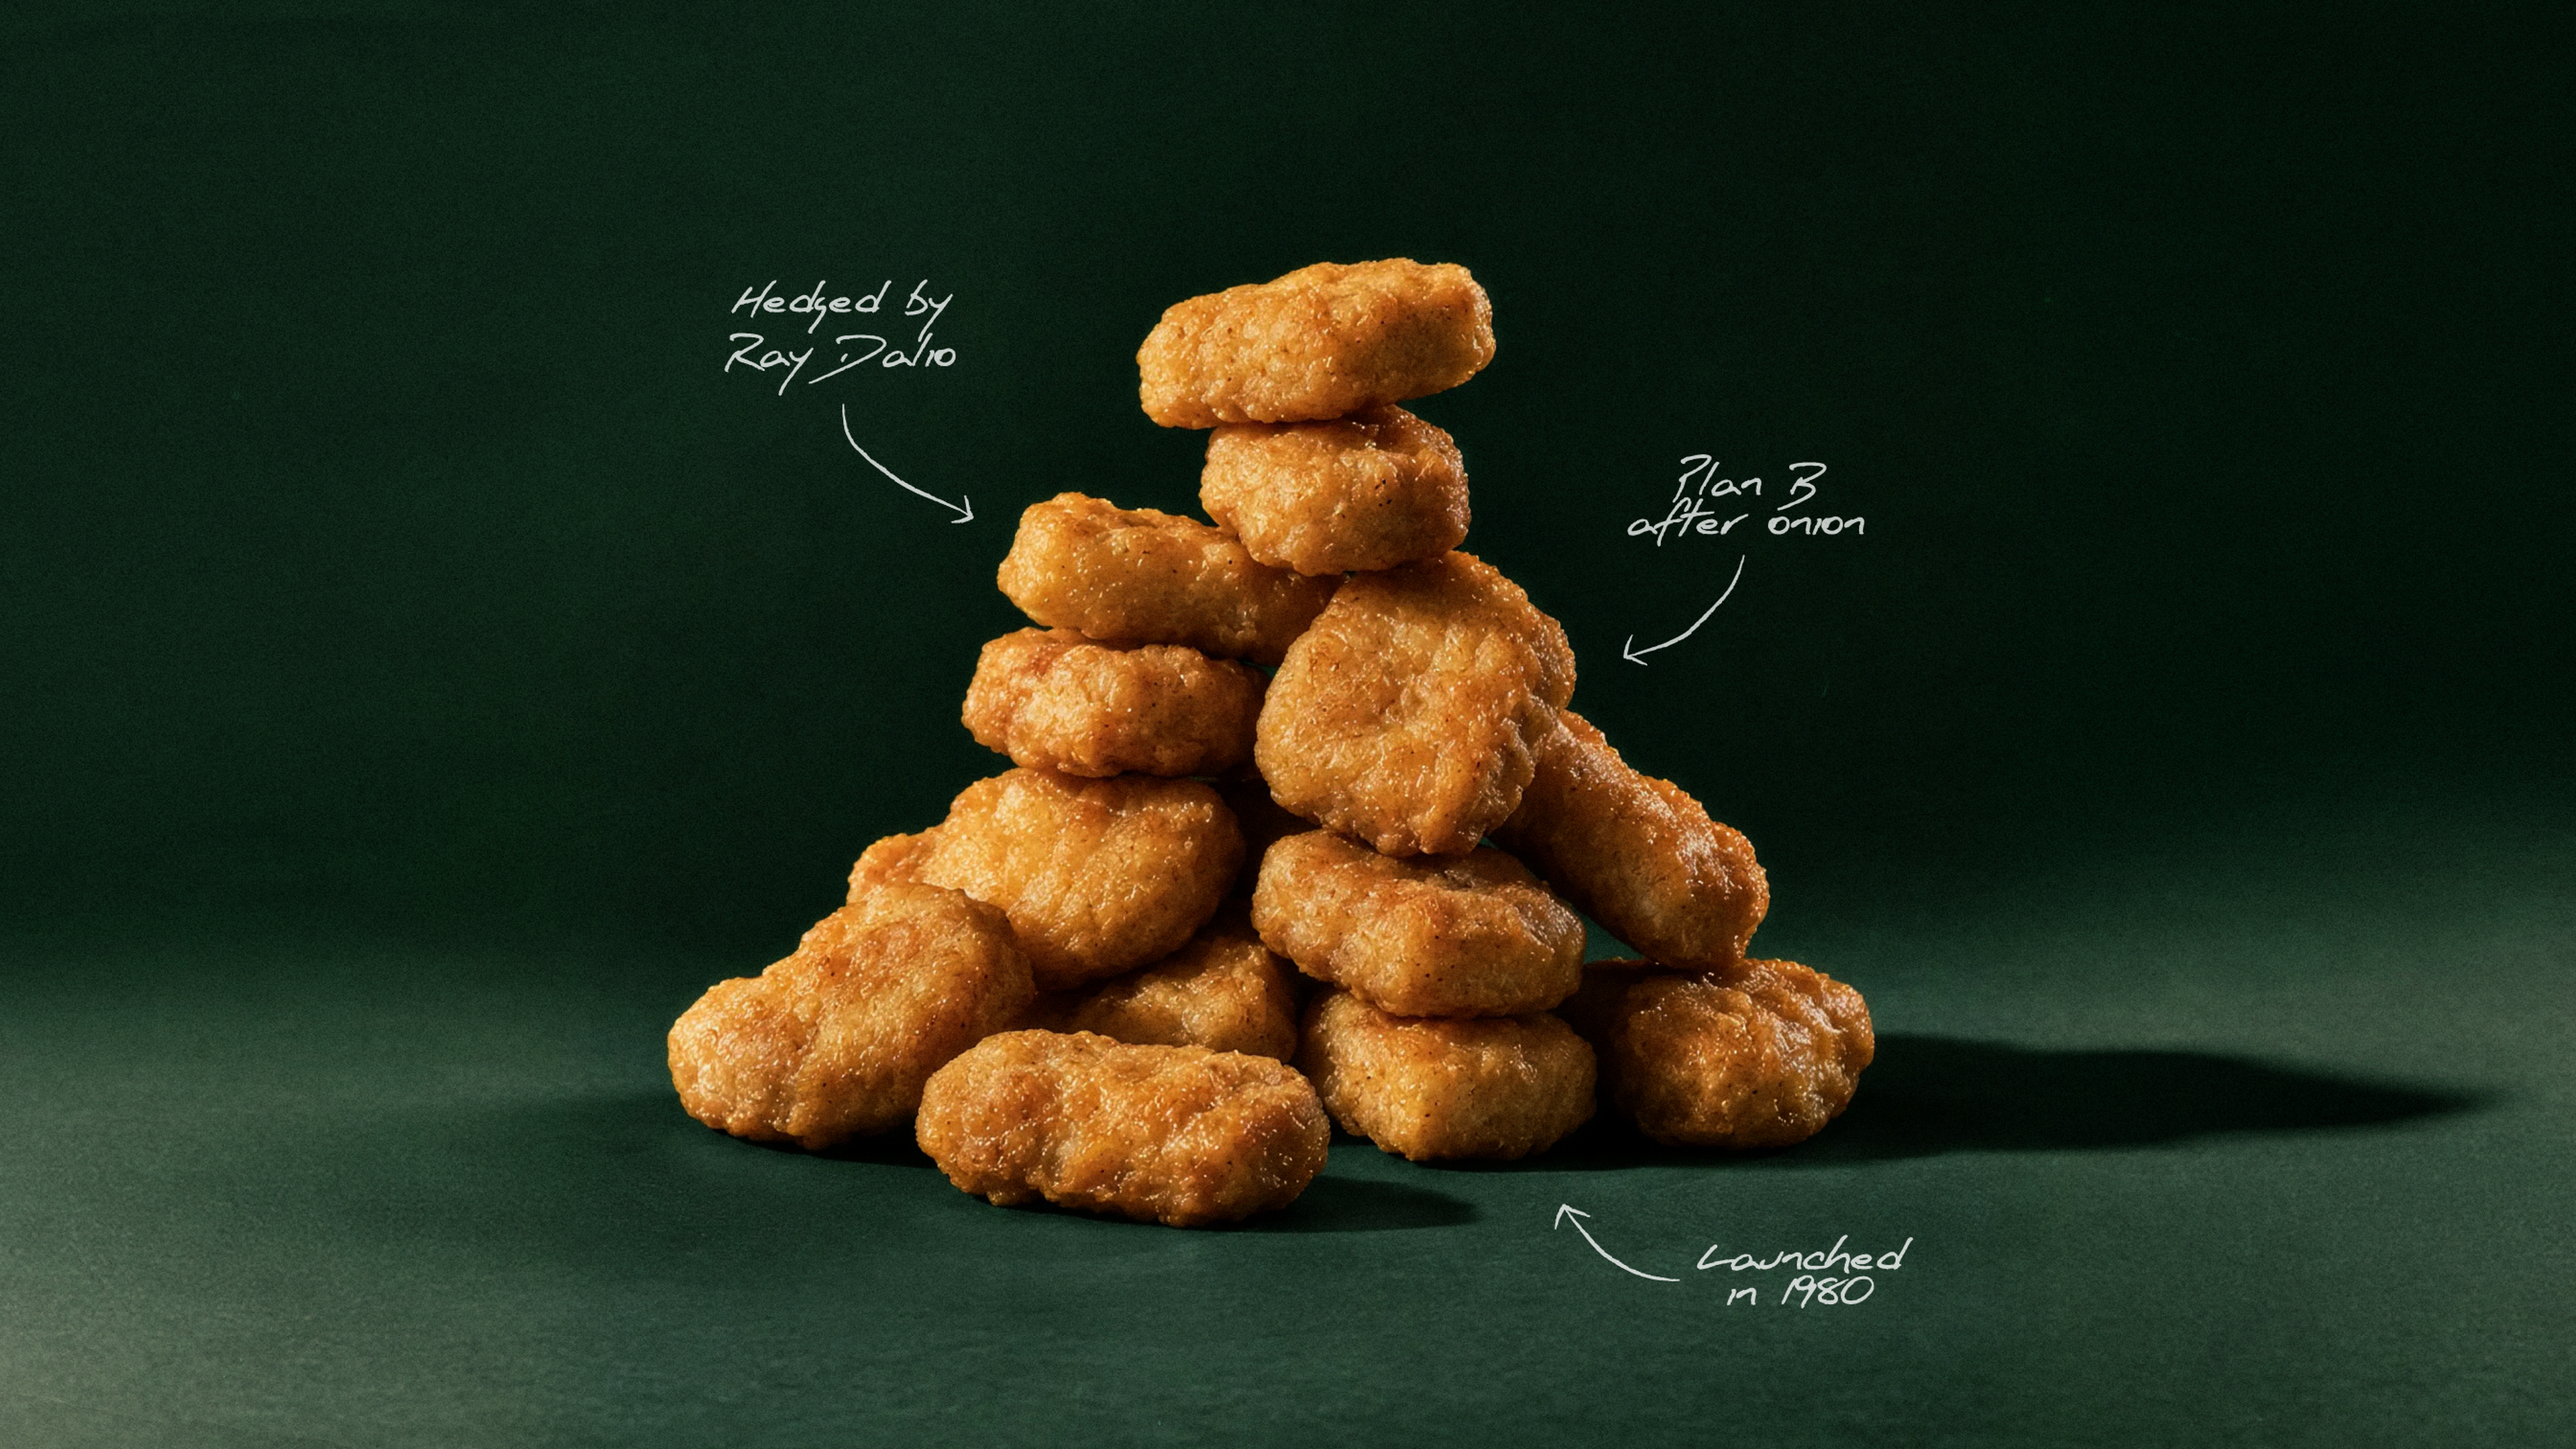
Winner, Winner: The Chicken McNugget Story
How a 1940s breeding contest, a Cornell food scientist, and a hedge by Ray Dalio helped McDonald's turn the Chicken McNugget into a fast-food icon.

4,411 properties across 43 states and Washington, DC; 2,040 wholly owned/consolidated, 408 in joint ventures and 1,963 managed as of September 30, 2026.
$29.4B equity market capitalization, 1,900+ third-party managed properties, 94.0% same-store occupancy and 5.2x net debt to EBITDA as of September 30, 2026.
U.S. self-storage share by square footage: 14.3%; independent operators account for an estimated 62%, supporting a fragmented-market consolidation opportunity.
Same-store occupancy reached 94.0%, up 50 bps YoY and above the 92.6% core average for 2013–2024.
Same-store revenue growth led peers by an average of 130 bps across 2015–2026; Q3 and YTD revenue and NOI growth accelerated QoQ, prompting higher 2026 full-year guidance.
2026 outlook assumptions: Core FFO per share $8.40–$8.50; same-store revenue growth 2.00%–2.50%, expenses 0.00%–0.50% and NOI growth 2.50%–3.50%.
New and existing customer rental-rate trends were described as improving; rental and vacate activity was stable QoQ and YoY.
Storage is presented as a need-based, recession-resilient asset class, with monthly rent of $119 compared with a $1,771 national median apartment rent and $2,175 monthly mortgage payment in July 2026.
Average length of stay for vacated customers rose to 18.4 months in 2025, versus 16.2 months in 2018.
Sector median NOI margin was 78%; 10-year dividend growth was 102%, the highest among the compared property sectors.

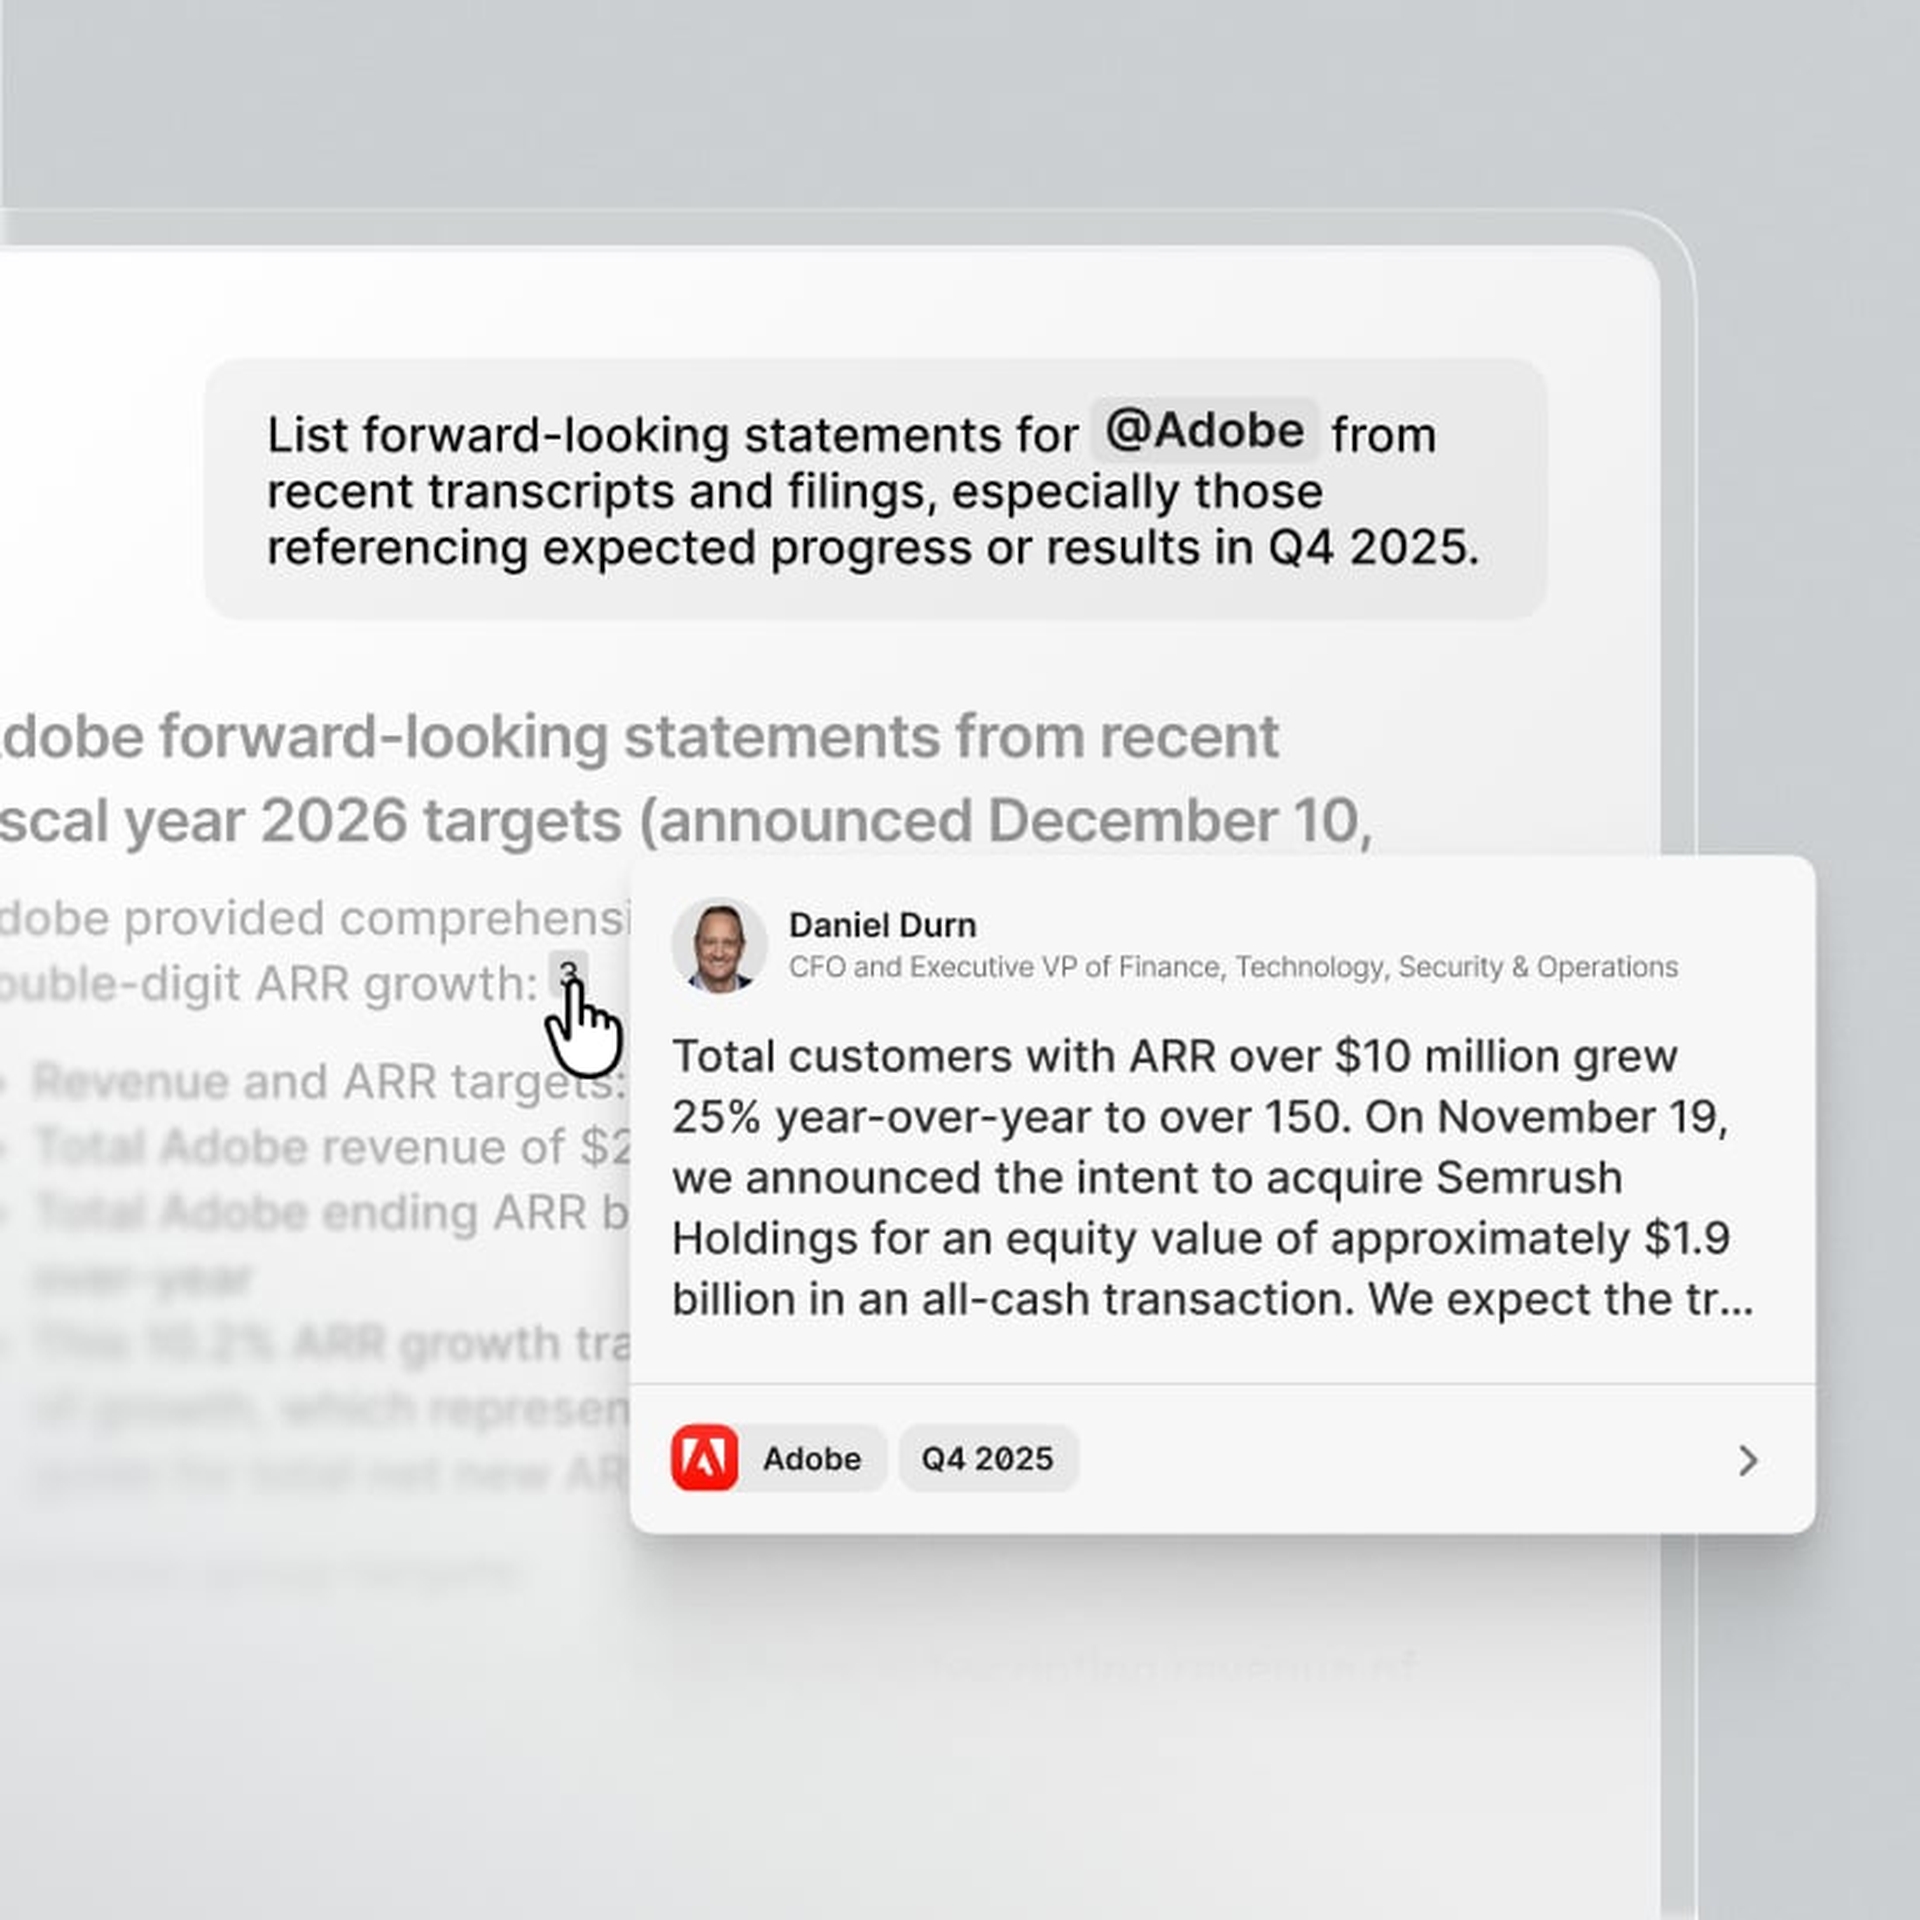
AI chat
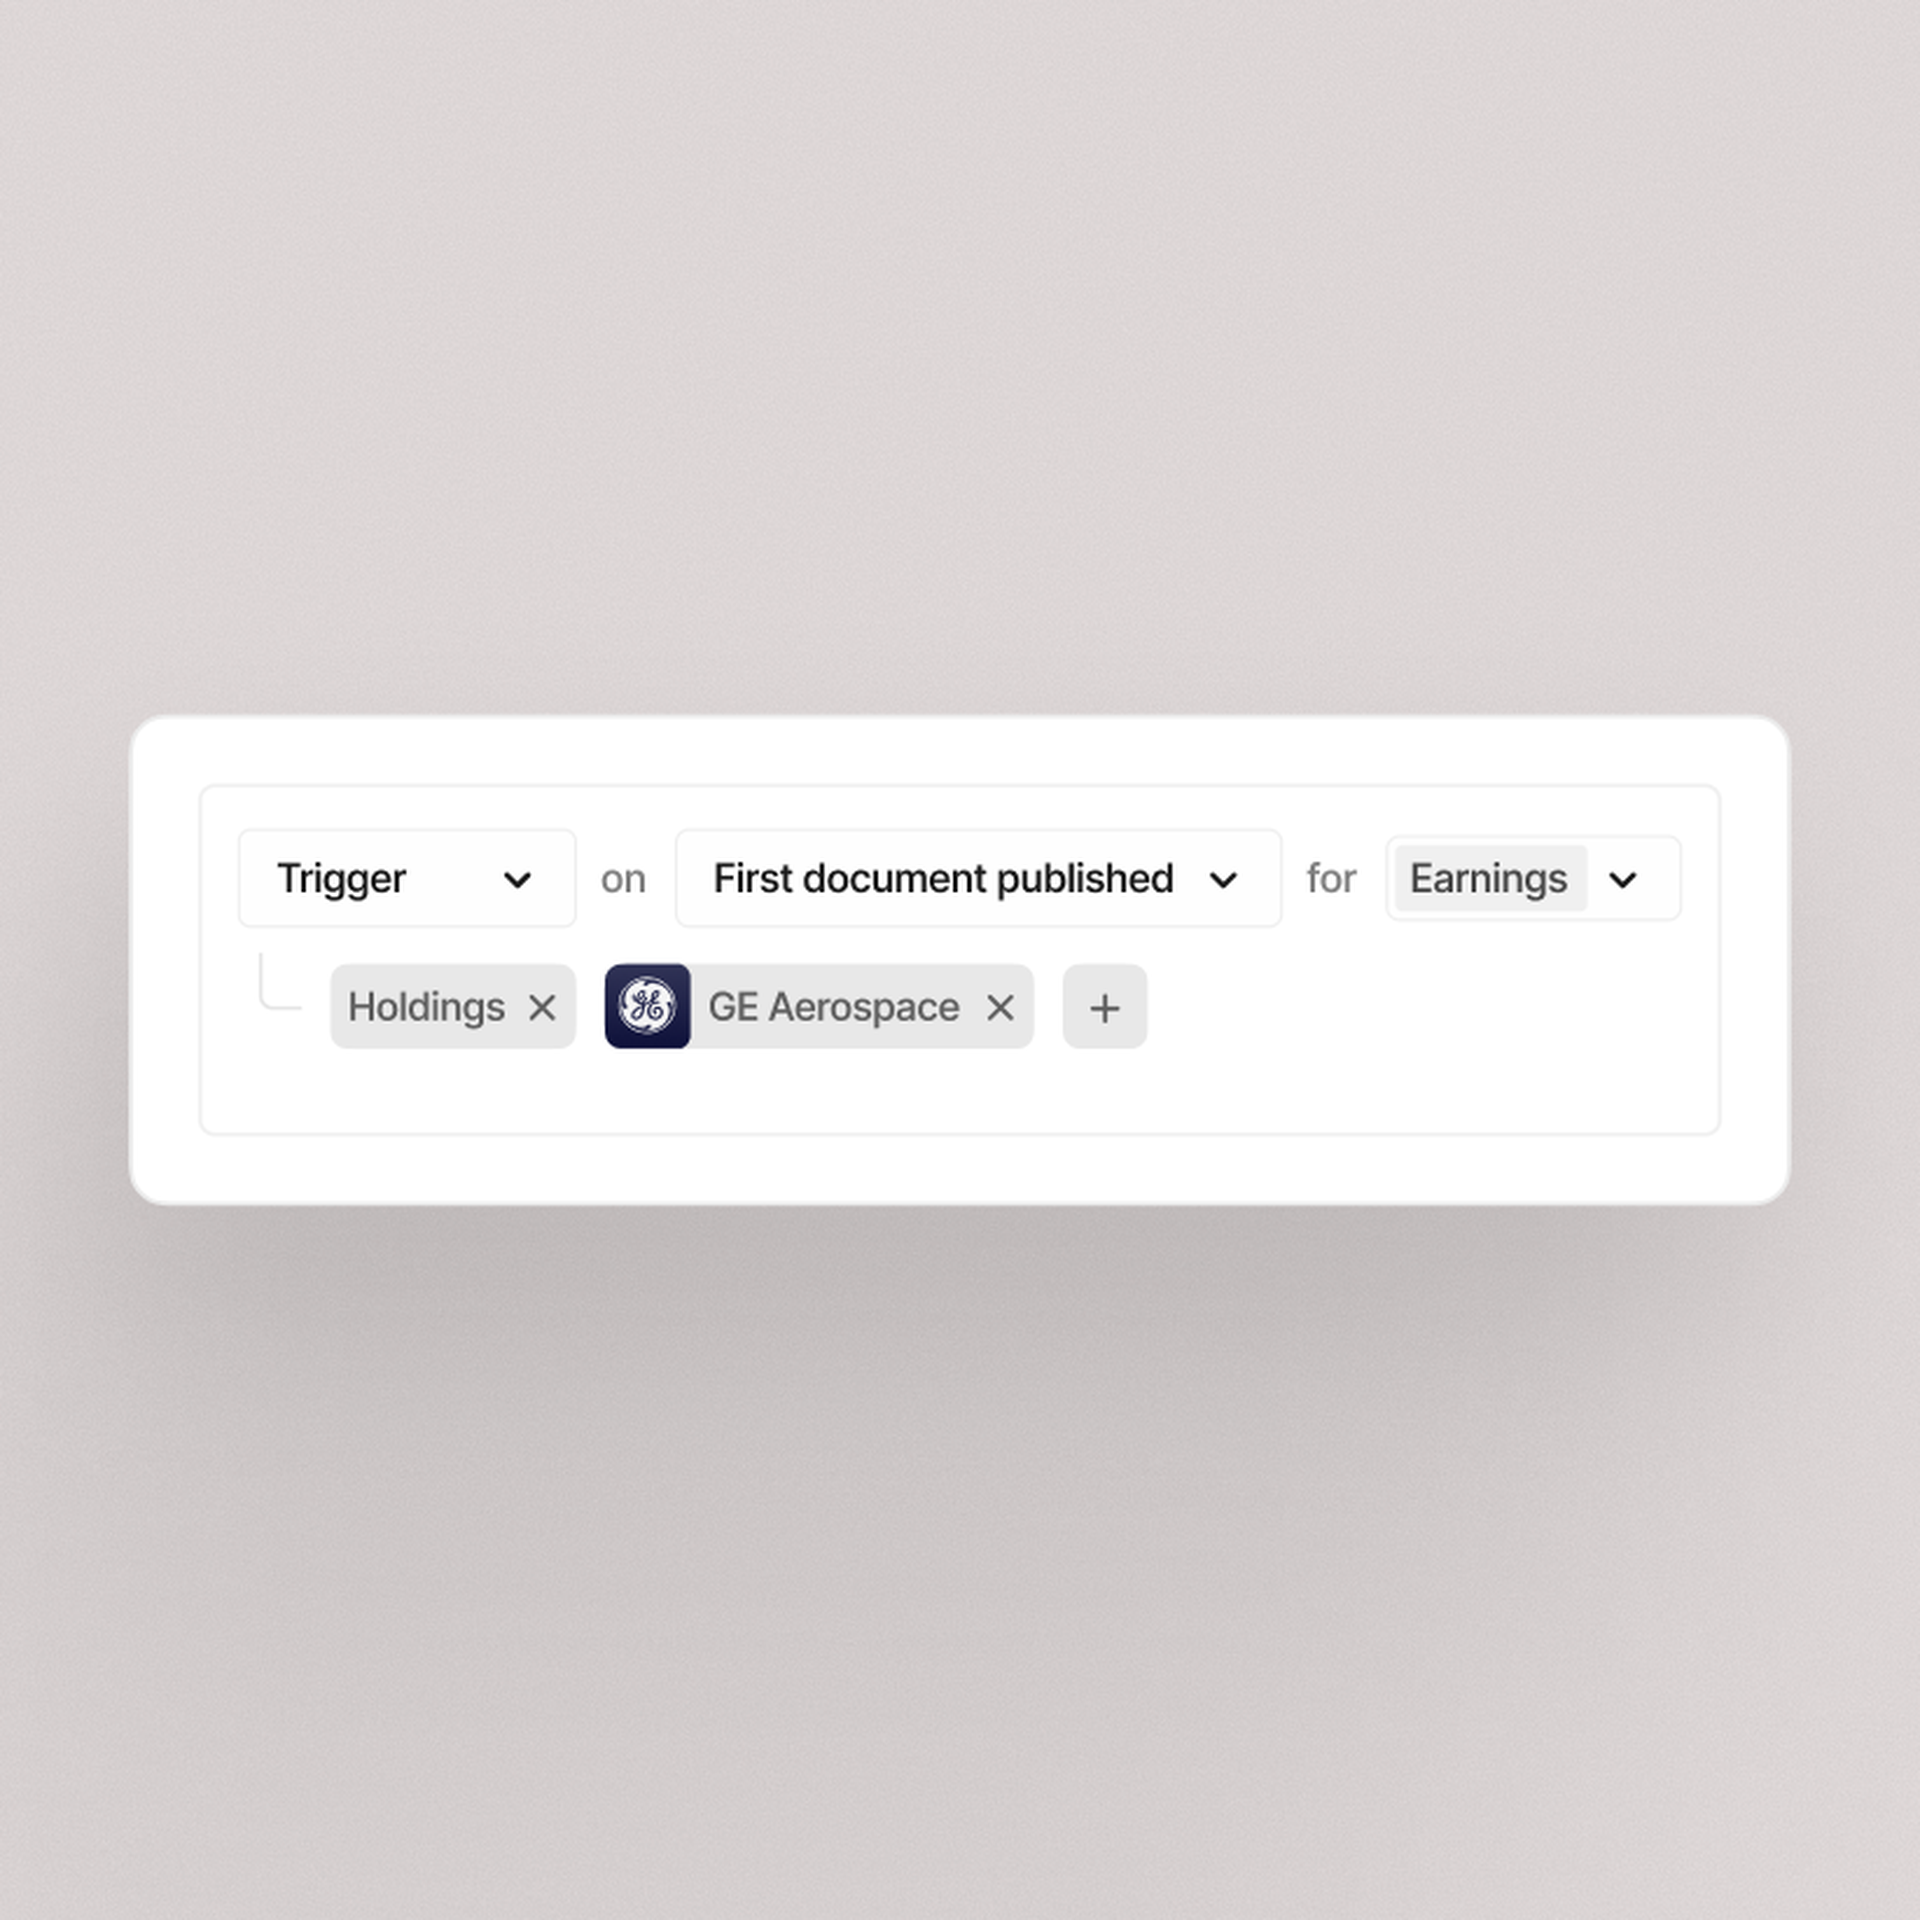
Automations

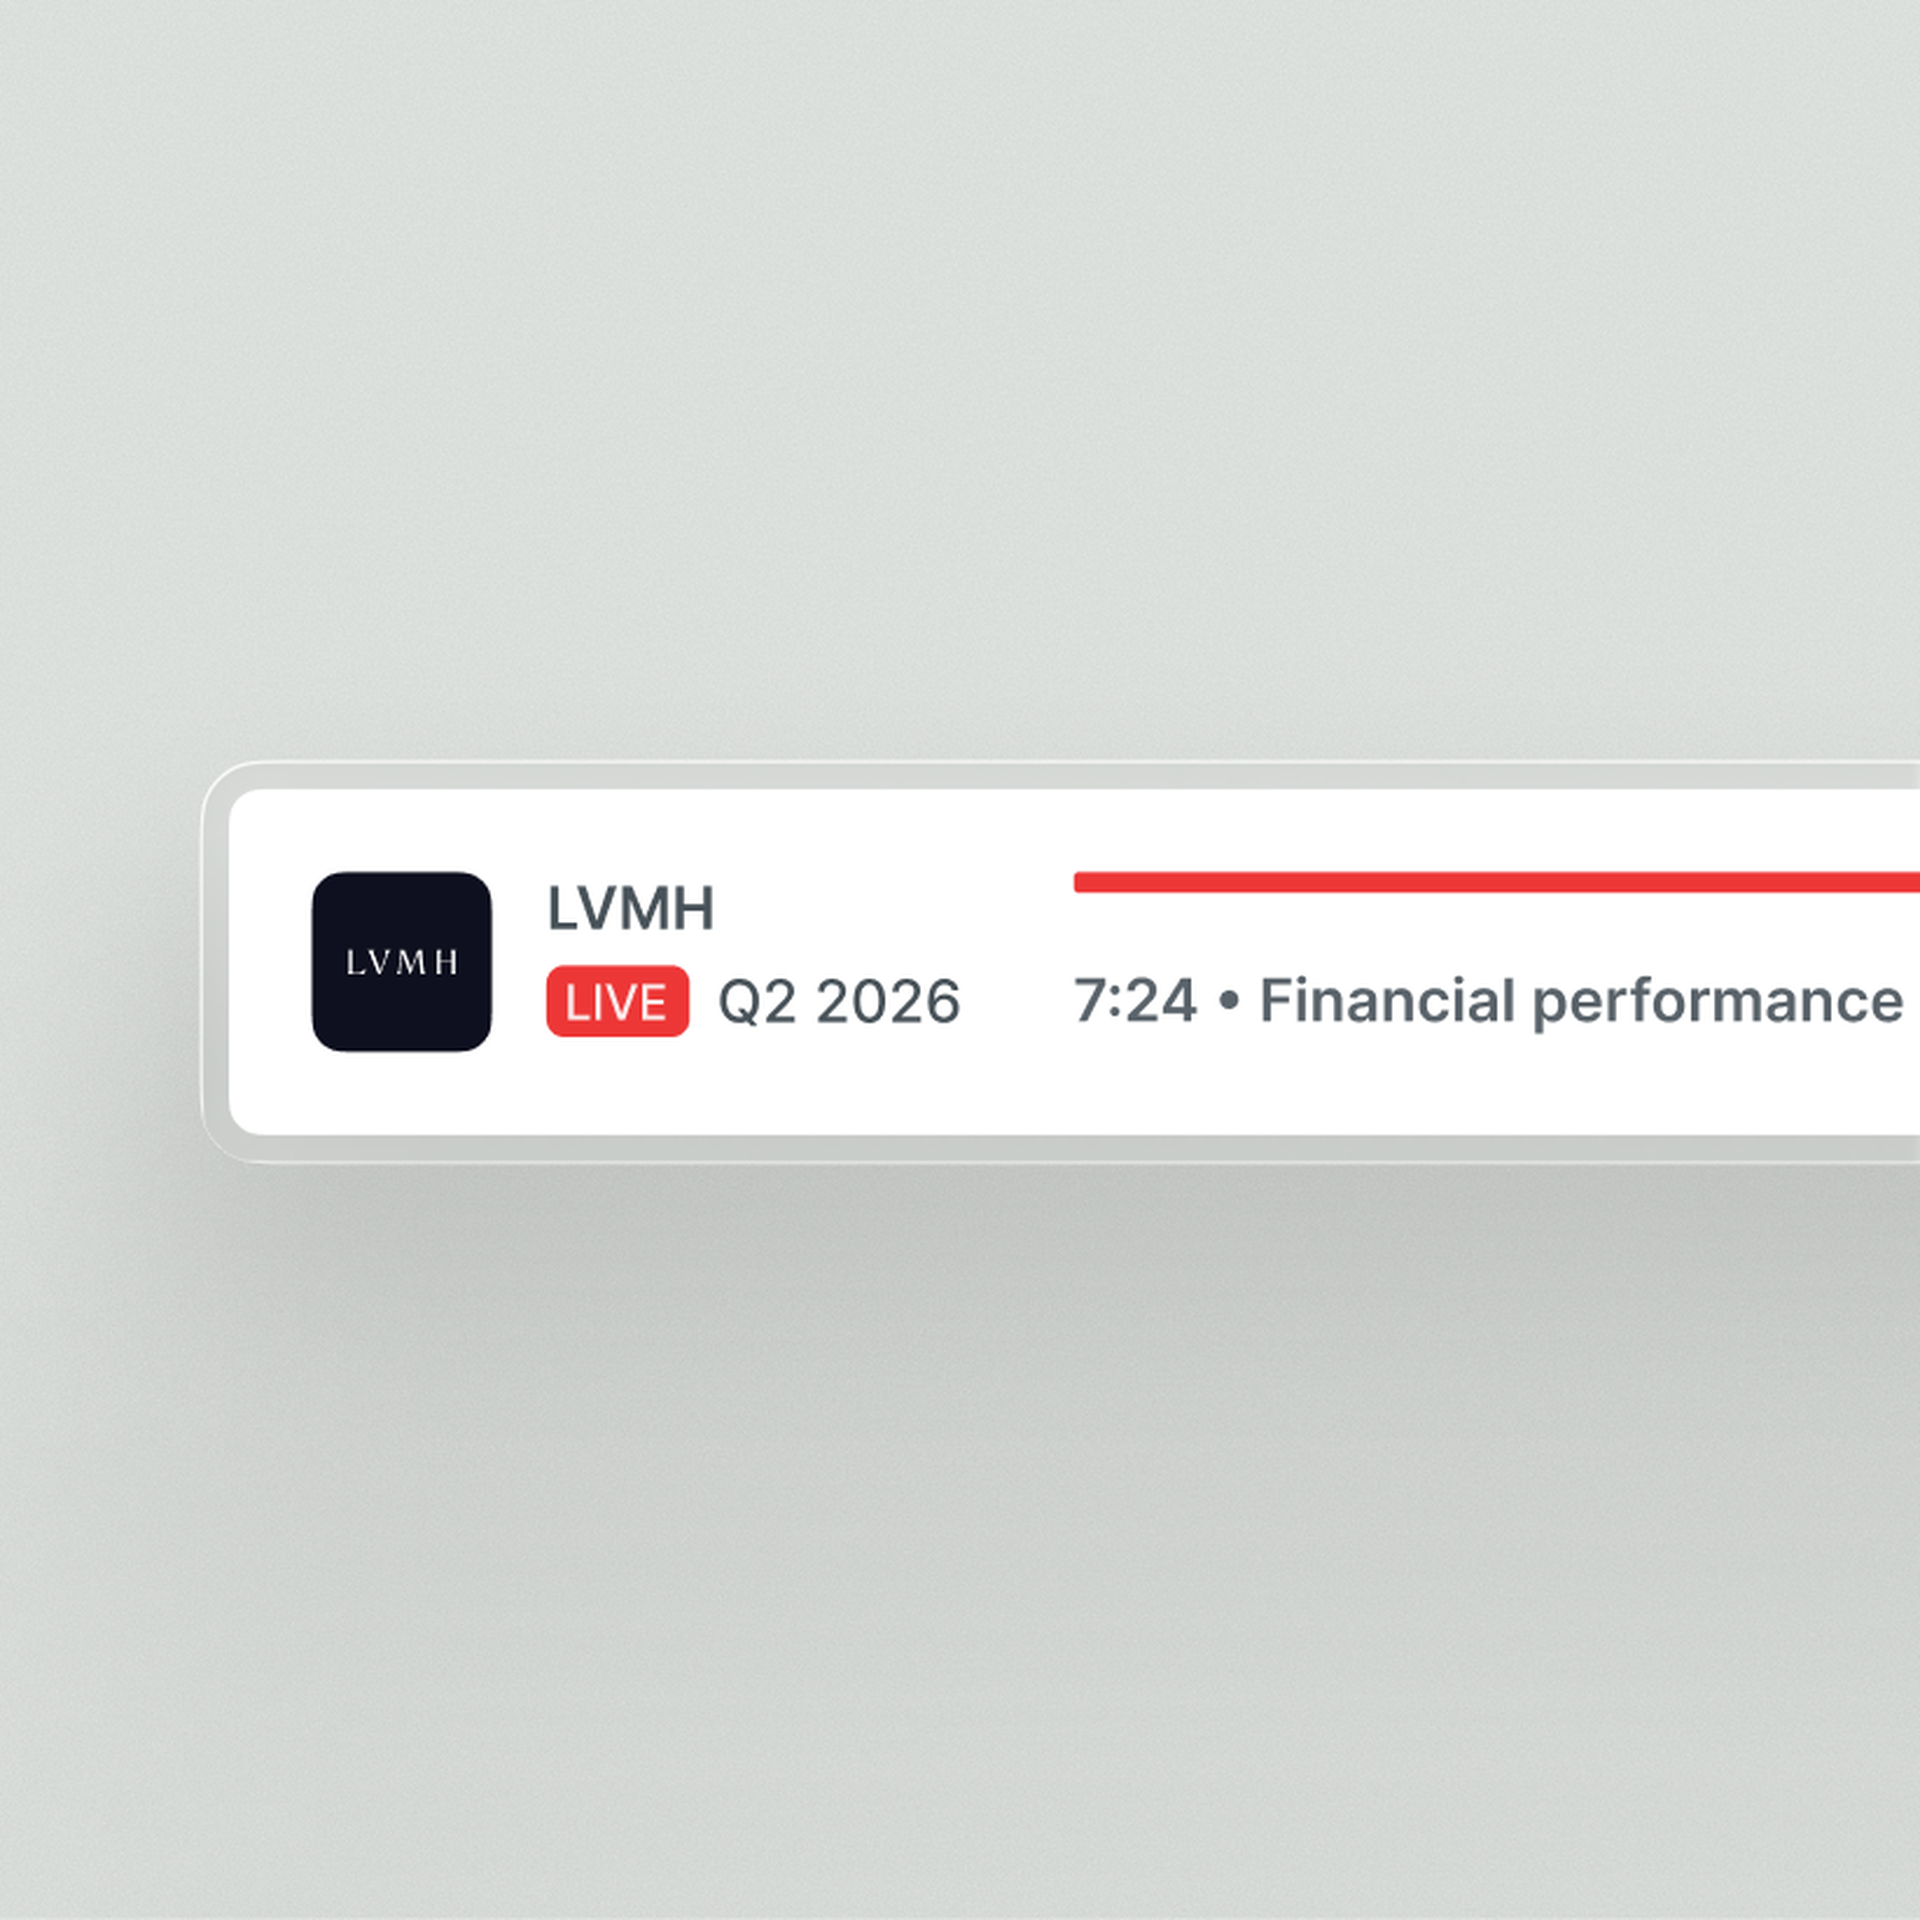
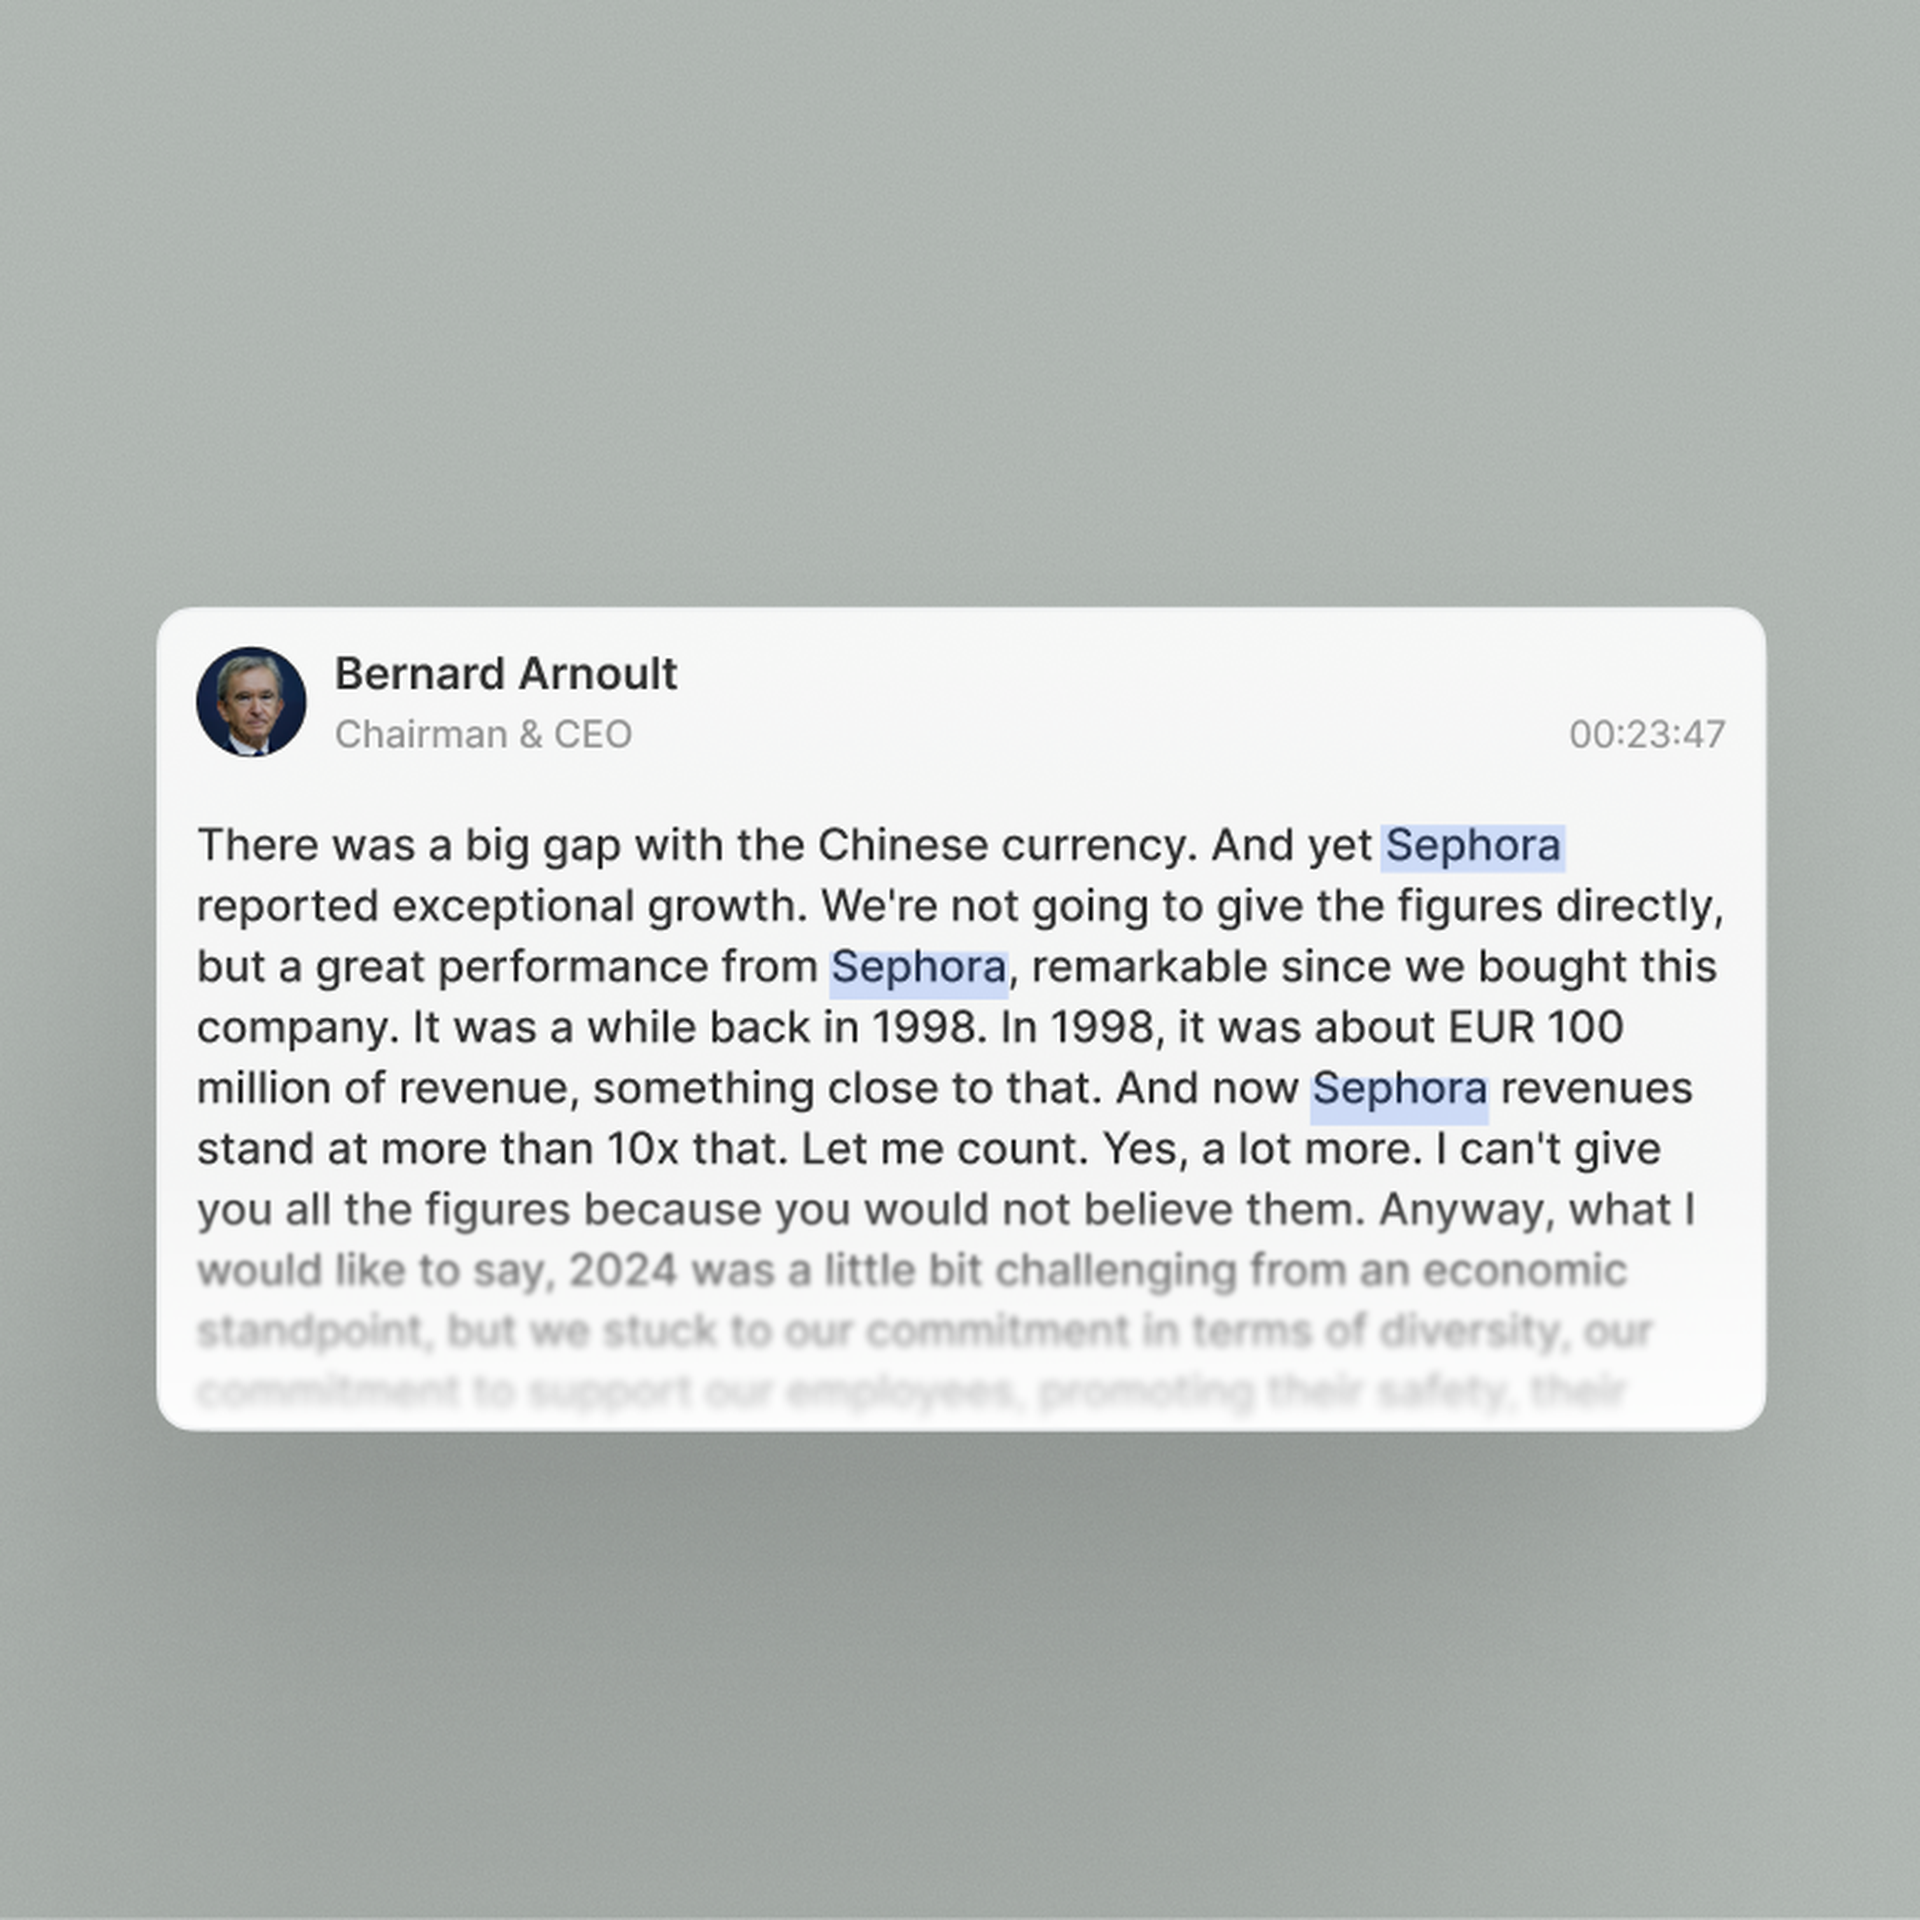
Live audio & transcripts
Quartr's AI stands out because it only pulls clean, first-party data from public companies. In investing, that's everything.
Jamie Ross
Investment Manager, GAM Investments
Research that used to take hours now takes seconds with Quartr Pro. Tracking shifts in tone or extracting tables, it's as simple as typing a query.
Tom O'Hara
Investment Director
Before Quartr we spent hours manually compiling insights through the peer earnings cycle. Now, these tasks are done faster, with greater precision.
Gregg Lampf
VP of Investor Relations
Being able to ask specific questions across years of transcripts and reports and instantly get verified answers is a game-changer.
Pontus Dackmo
CEO & Investment Manager