
Company research17 Jan 2024
The Largest Announced M&A Deals of 2023
Explore the biggest M&A deals of 2023, including major moves in energy, tech, and biotech sectors, reflecting a trend in strategic growth.

Q3 reported earnings were $15.413B ($3.72/share) and adjusted earnings were $17.505B ($4.23/share); operating cash flow was $25.650B and free cash flow was $19.109B.
Higher prices and refining margins, advantaged production and structural savings supported results; Middle East disruptions and derivative timing effects were offsets. Q3 shareholder returns totaled $9.4B.
Nine-month reported earnings were $34.121B versus $22.343B; adjusted earnings were $40.957B versus $22.457B.
Nine-month operating cash flow was $57.910B; cash capex was $19.976B and free cash flow was $39.0B, or $38.8B excluding working capital and other items.
Higher prices and margins added $22.7B to year-to-date adjusted earnings, while advantaged volume growth added $2.7B; lower base volumes, higher expenses and Middle East disruptions were headwinds.
Q3 cash capex was $7.002B, down from $8.595B a year earlier; Q3 revenues and other income were $113.164B versus $85.294B.
FY26 cash capex guidance is $27B–$29B; 2027–2030 cash capex is planned at $28B–$32B.
FY26 Permian production is expected at ~1.8M boe/d; the fifth Guyana FPSO is expected to start up in late Q4, with Q4 Middle East production impacts assumed at 350k boe/d.
Q4 Product Solutions maintenance is expected to exceed Q3 levels; corporate and financing expenses are estimated at $500M–$700M.
2030 targets include ~$25B earnings growth and ~$35B cash flow growth from 2024 at constant prices and margins, ~5.5M boe/d of Upstream production and >$15/boe unit earnings.
Share repurchases are planned at $20B in 2027, assuming reasonable market conditions; Uaru is expected to start up in Q4 and Rovuma LNG FID remains targeted by year-end, subject to hurdles.

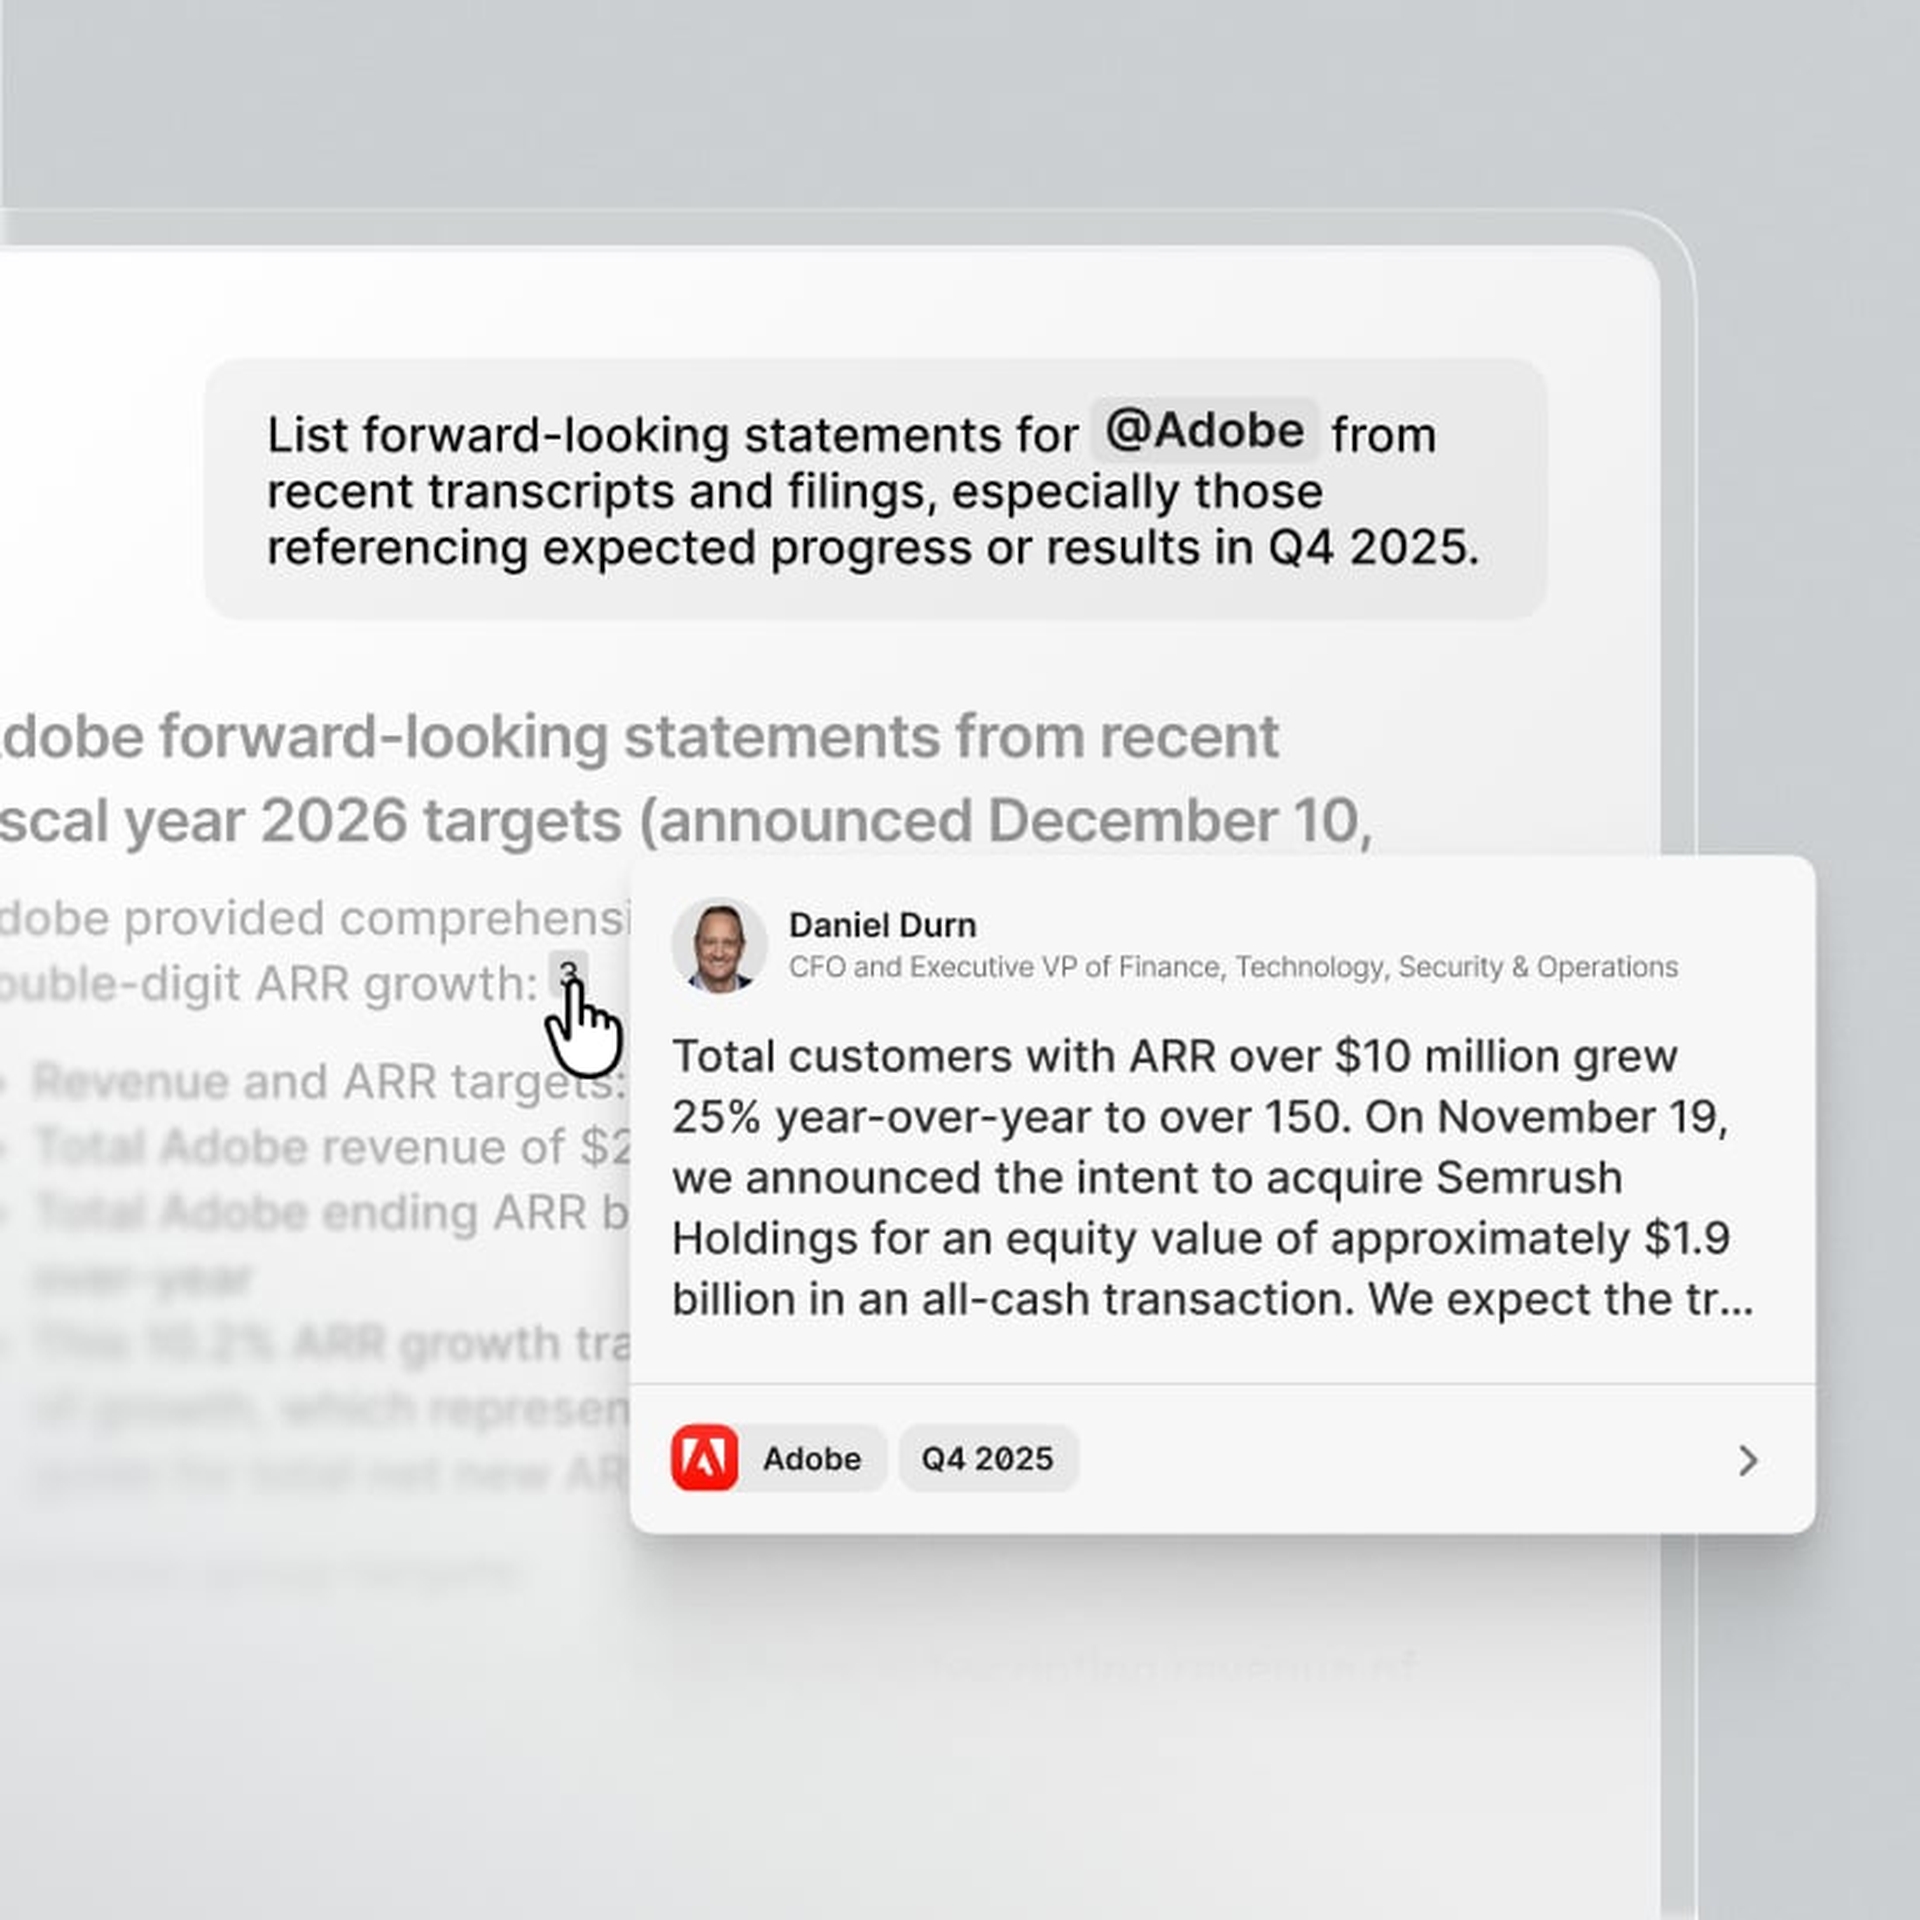
AI chat
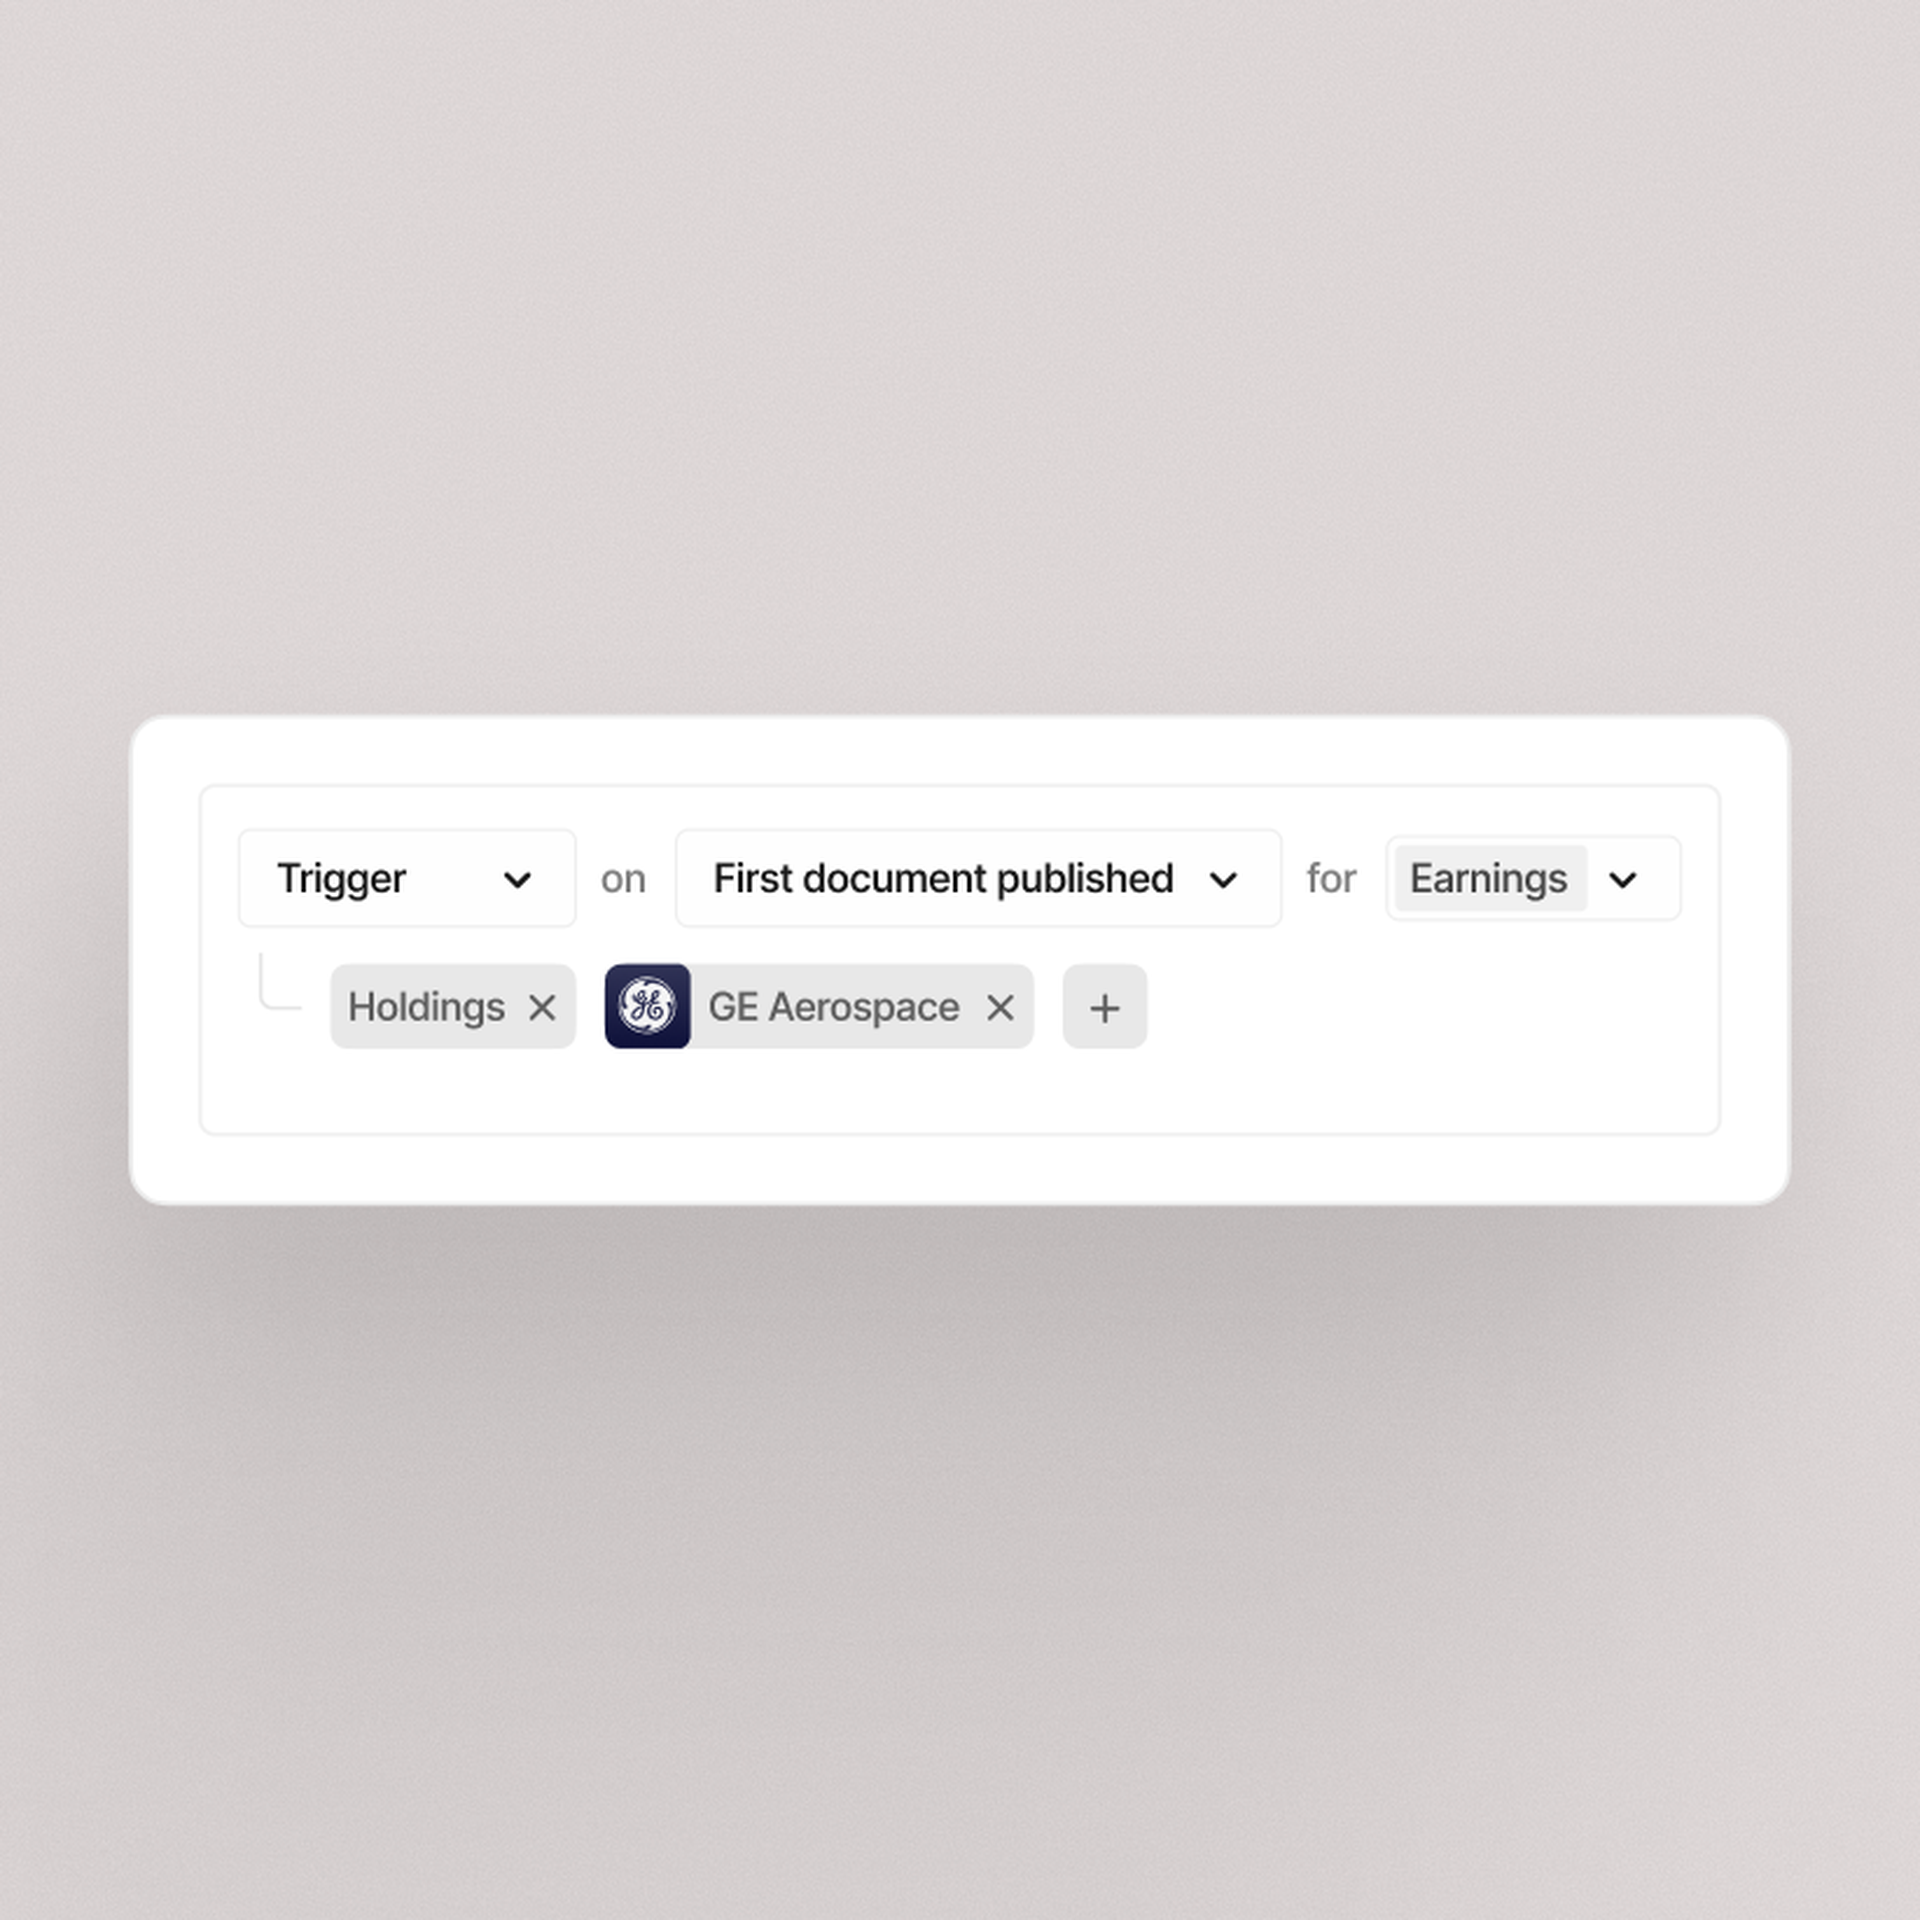
Automations

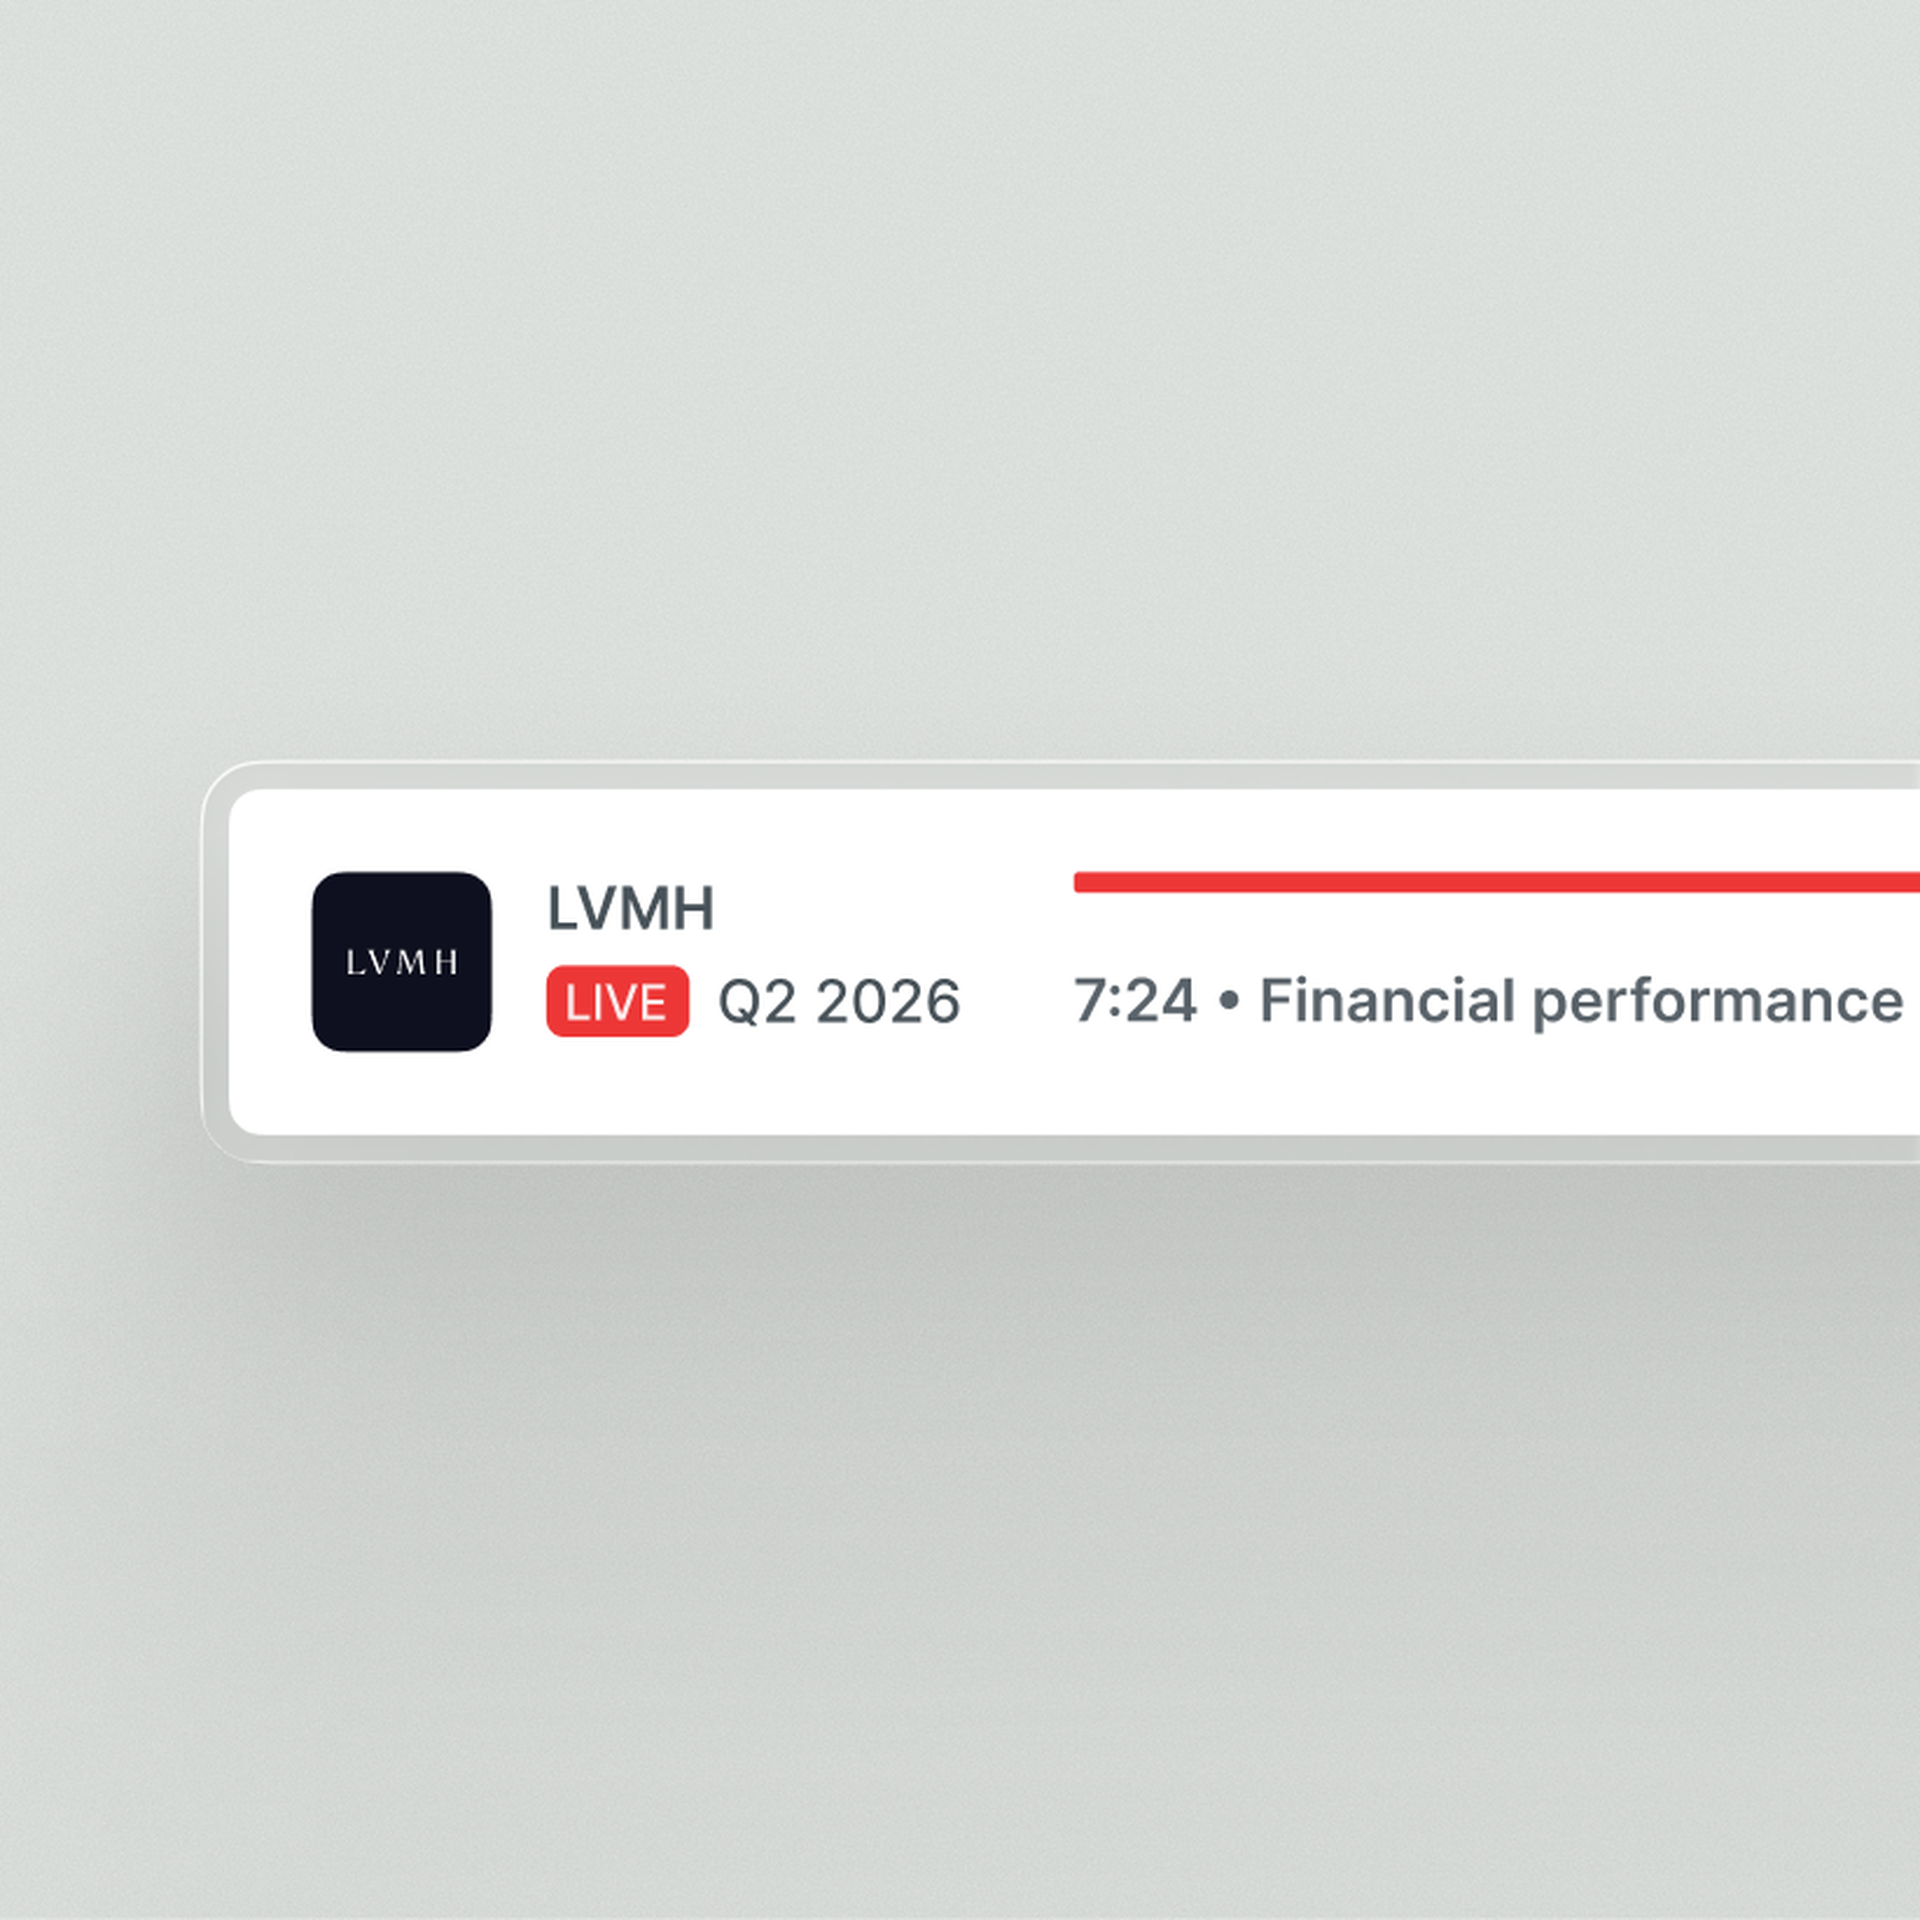
Live audio & transcripts
Quartr's AI stands out because it only pulls clean, first-party data from public companies. In investing, that's everything.
Jamie Ross
Investment Manager, GAM Investments
Research that used to take hours now takes seconds with Quartr Pro. Tracking shifts in tone or extracting tables, it's as simple as typing a query.
Tom O'Hara
Investment Director
Before Quartr we spent hours manually compiling insights through the peer earnings cycle. Now, these tasks are done faster, with greater precision.
Gregg Lampf
VP of Investor Relations
Being able to ask specific questions across years of transcripts and reports and instantly get verified answers is a game-changer.
Pontus Dackmo
CEO & Investment Manager
ExxonMobil is a multinational oil and gas corporation based in Irving, Texas. The company was formed in 1999 through the merger of Exxon Corporation and Mobil Corporation and has since become one of the largest energy companies in the world. Some of ExxonMobil's competitors include Chevron, BP, and ConocoPhillips.
ExxonMobil's business model is based on the exploration, production, transportation, and sale of oil and gas products around the world. The company operates in over 50 countries, with a focus on developing and managing large-scale energy projects that have a significant impact on the global energy industry.
ExxonMobil generates revenue primarily through the sale of oil and gas products, as well as through its chemical and refining operations.
The company's products include:
Crude oil
Natural gas
Gasoline
Diesel fuel
And petrochemicals
In addition, ExxonMobil also generates revenue through various other services, including lubricants, electricity, and renewable energy.
ExxonMobil is one of the largest companies in the world, and has a rich history dating back over 150 years, with a legacy of innovation and technological advancement. The company was one of the first to develop offshore drilling technology in the 1950s, and it also pioneered the use of 3D seismic imaging technology for oil exploration in the 1970s.