Edge16 Oct 2026
Winner, Winner: The Chicken McNugget Story
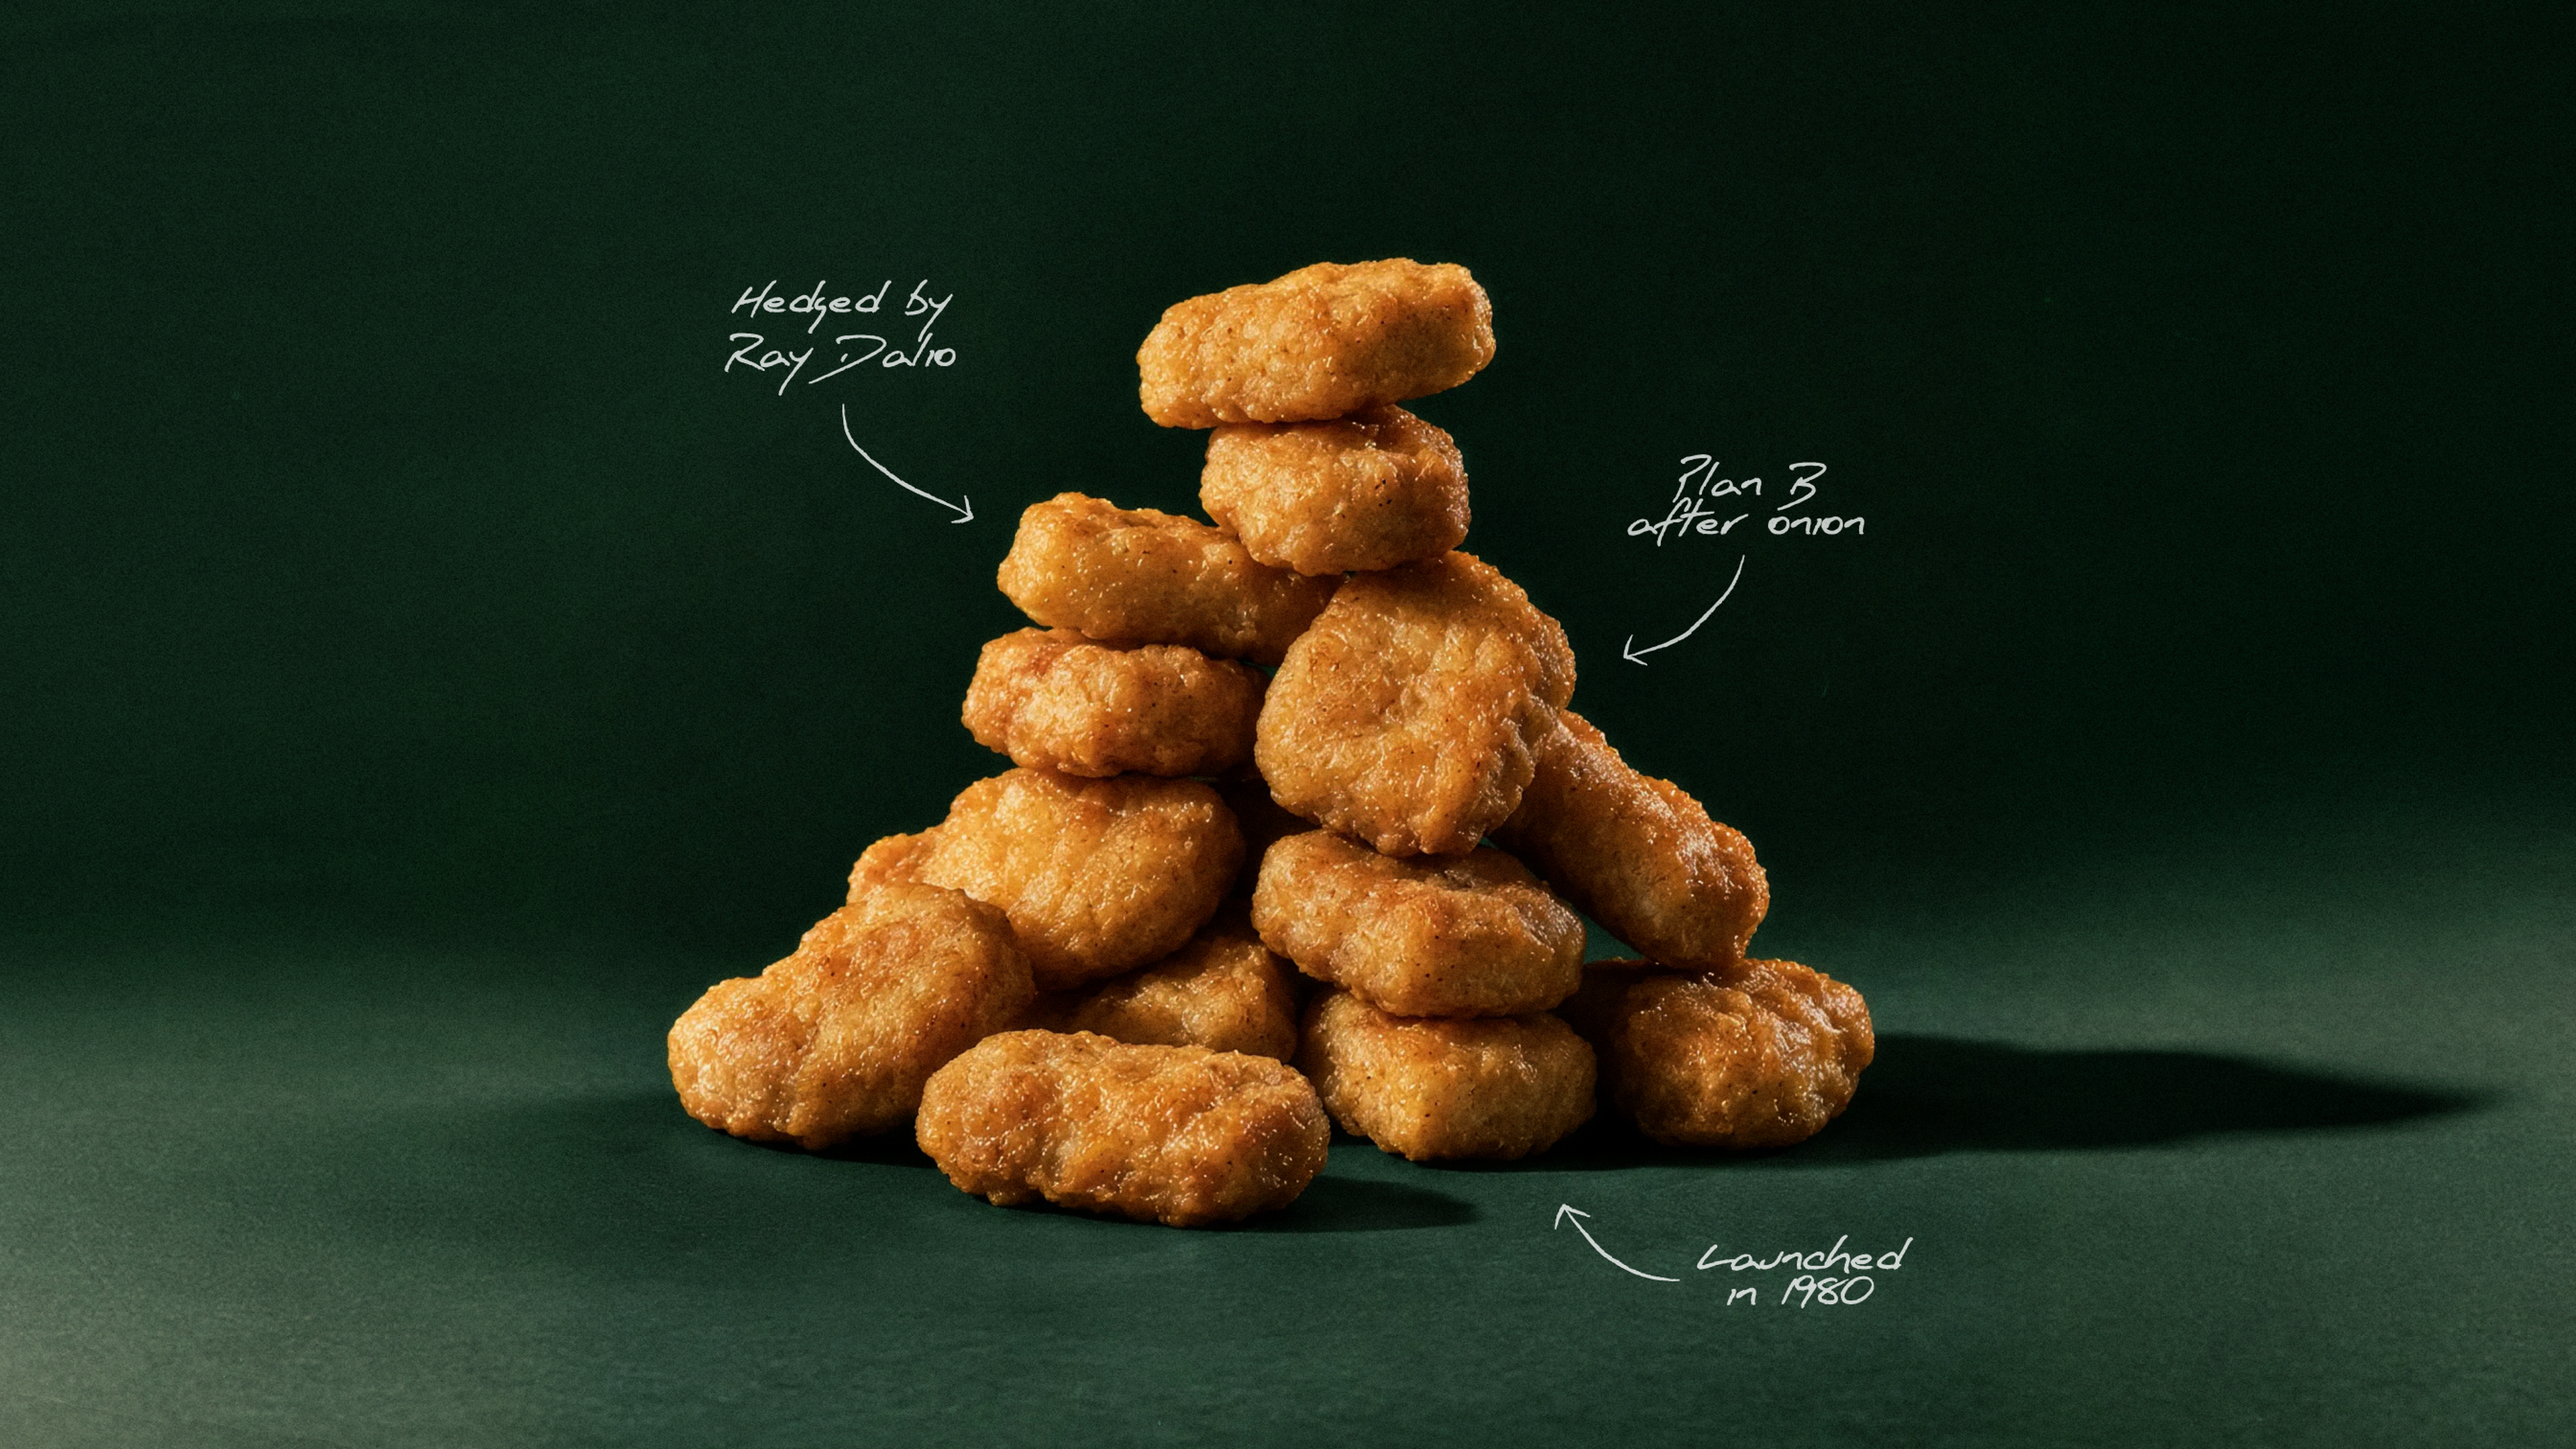
How a 1940s breeding contest, a Cornell food scientist, and a hedge by Ray Dalio helped McDonald's turn the Chicken McNugget into a fast-food icon.

Q3 net sales rose 3.7% to $1.873B and core sales grew 3.3%, marking a second consecutive quarter of growth across both geographies, four of six businesses and seven of the top 10 brands.
Normalized margins, earnings and EBITDA improved; GAAP operating income fell to $27M and net loss was $81M, primarily reflecting a $101M noncash tradename impairment.
FY sales guidance rose while normalized operating margin and EPS guidance midpoints were maintained despite higher inflation expectations.
Q3 GAAP gross margin was 34.7% vs. 34.1%; normalized gross margin was 35.2% vs. 34.5%, up 70 bps YoY.
Normalized operating income rose to $184M from $162M, with margin at 9.8% vs. 8.9%; normalized diluted EPS was $0.20 vs. $0.17.
Q3 net loss was $81M and diluted EPS was $(0.19), vs. net income of $21M and diluted EPS of $0.05; operating income was $27M vs. $119M.
9M sales increased 2.1% to $5.416B and operating income rose 10.6% to $344M; net loss was $8M vs. $30M net income.
9M gross margin expanded to 36.4% from 34.0%, including tariff-refund benefits; normalized EBITDA rose to $789M from $641M.
Q4 net and core sales growth forecast at 1%–3%; normalized operating margin at 8.4%–9.0% and normalized diluted EPS at $0.17–$0.19.
FY 2026 net sales growth guidance raised to 2%–3% and core sales growth to 1%–2%; normalized operating margin remains 10.0%–10.4%.
FY normalized diluted EPS guidance is $0.74–$0.76, midpoint $0.75 unchanged; includes ~$100M, or $0.17/share, of IEEPA tariff-cost recovery recorded in Q2.
FY operating cash flow guidance revised to ~$150M due to two one-time items; underlying operational guidance remains ~$400M excluding them.
2027 base plan assumes positive core sales growth, ~$150M inflation, modest early-year pricing and normalized operating margin growth above the 50 bps evergreen target, excluding the 2026 tariff-refund benefit.

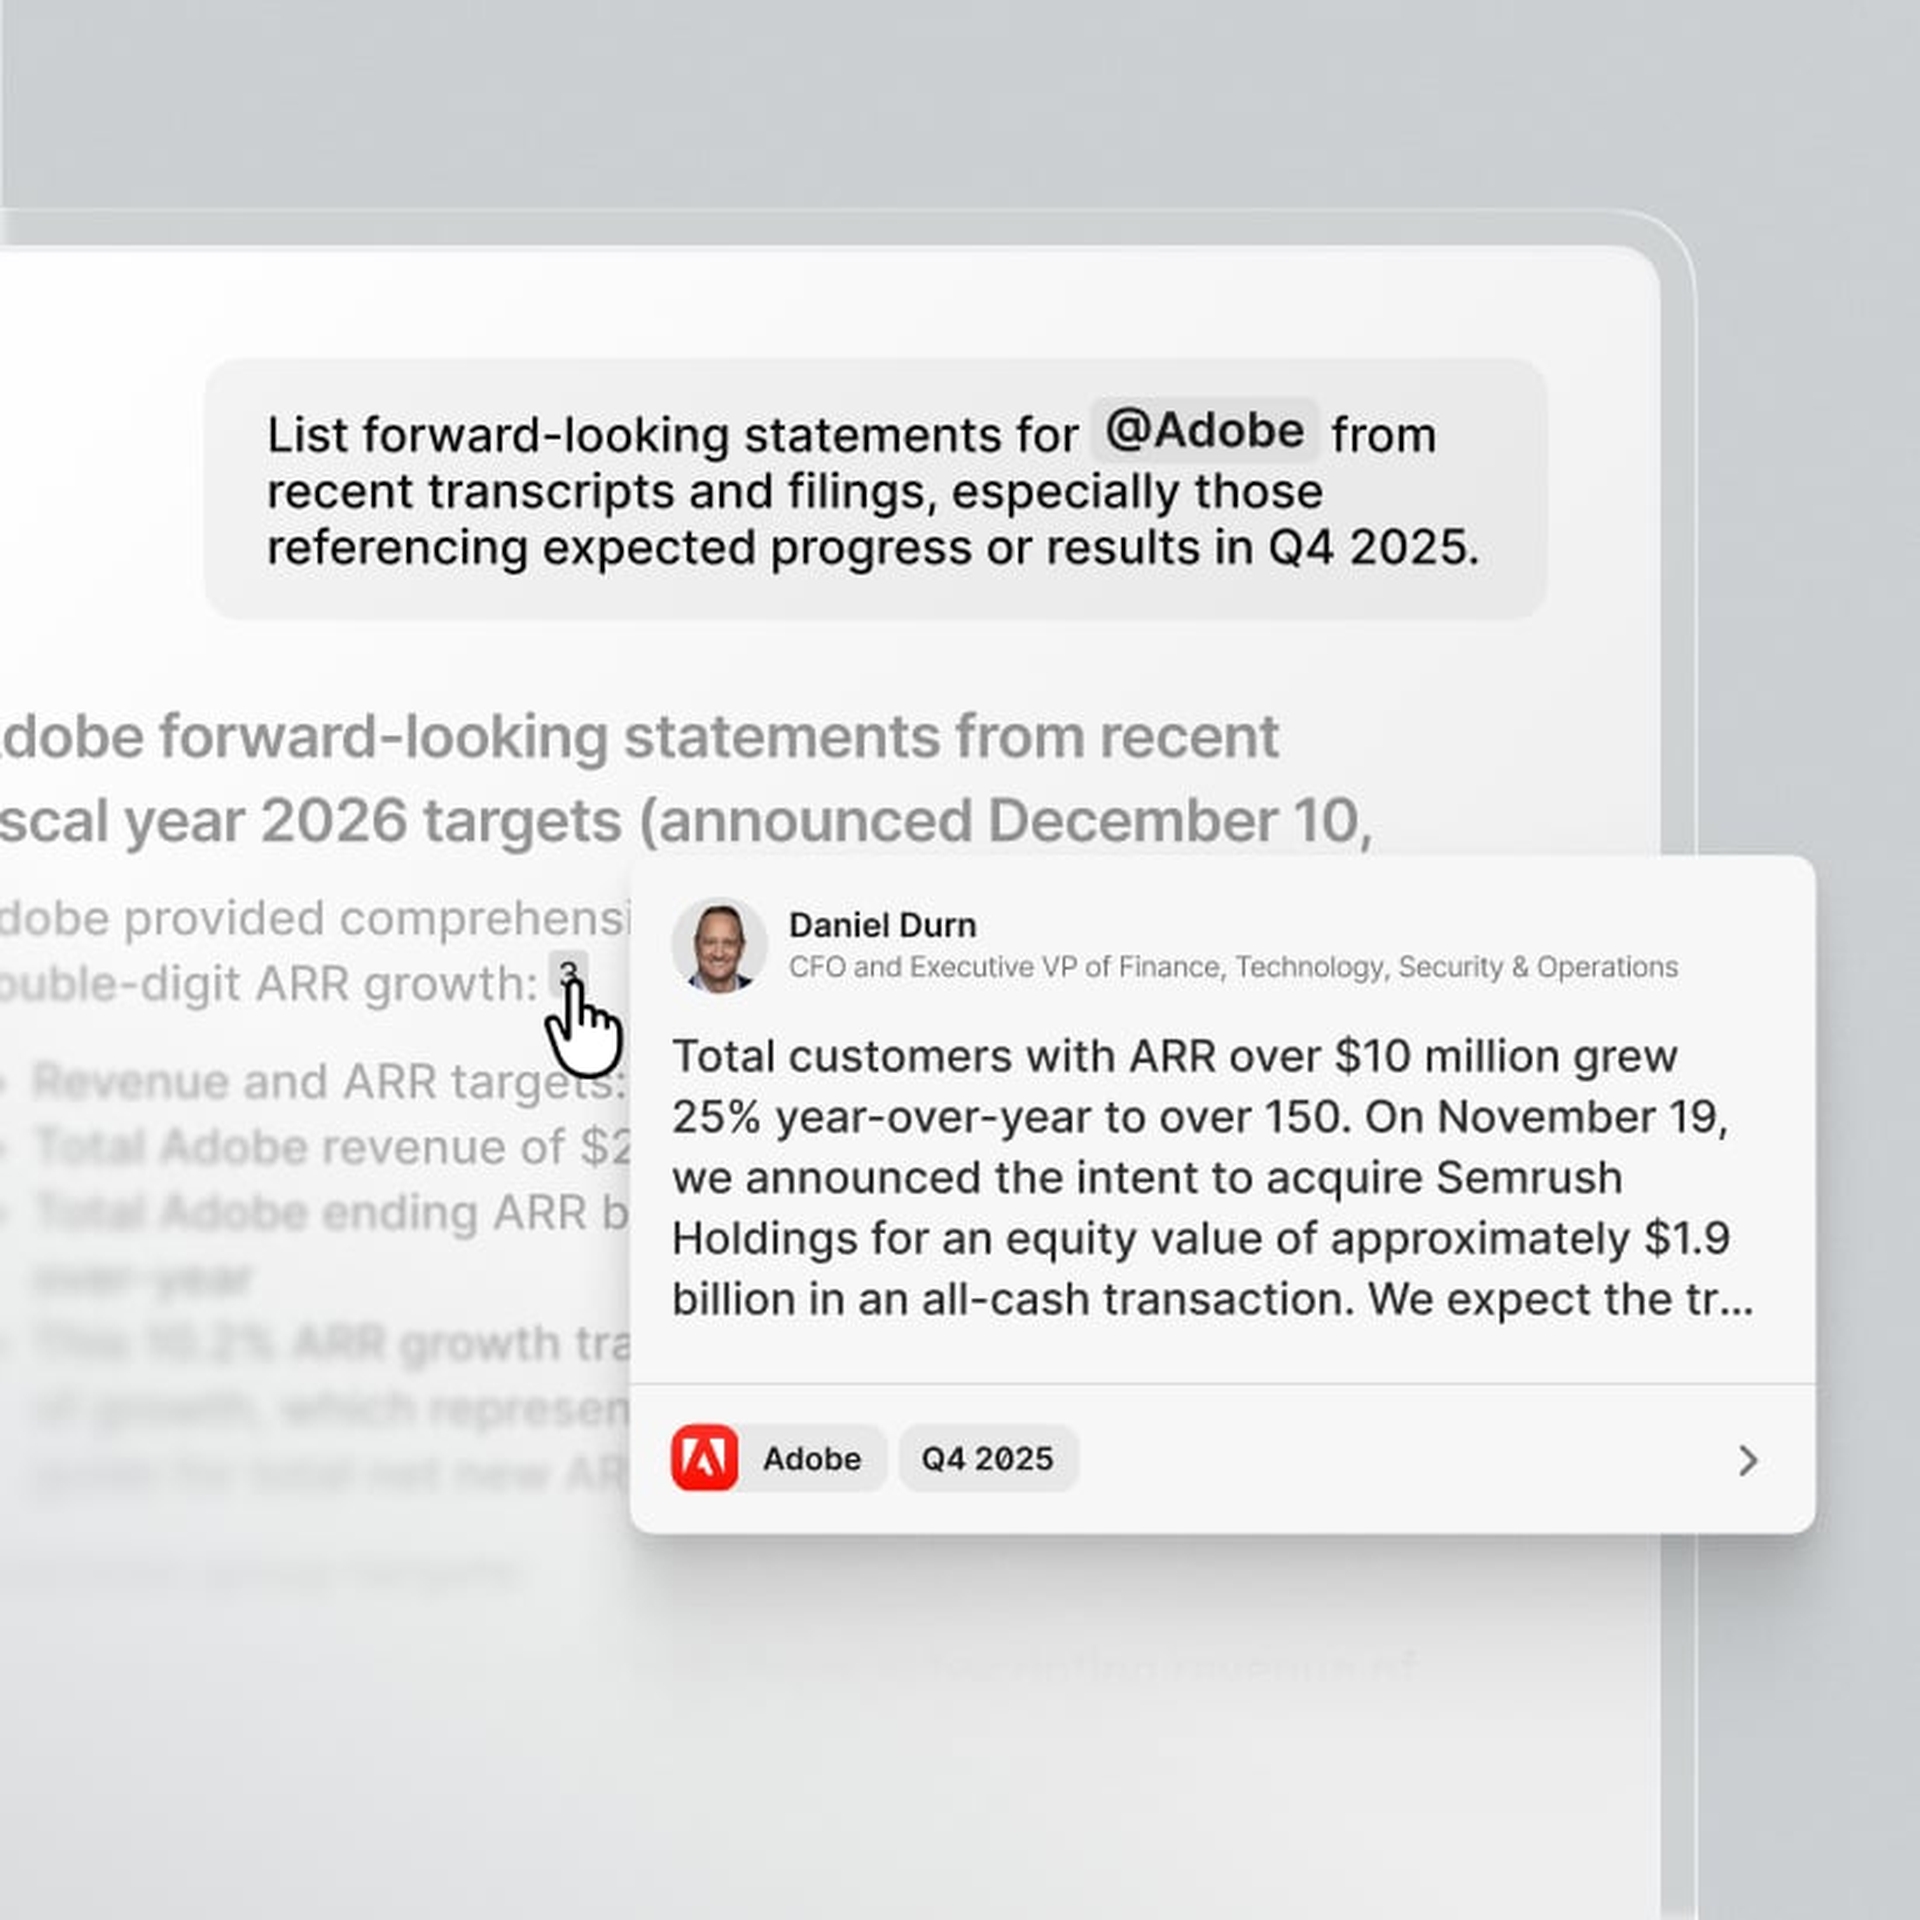
AI chat
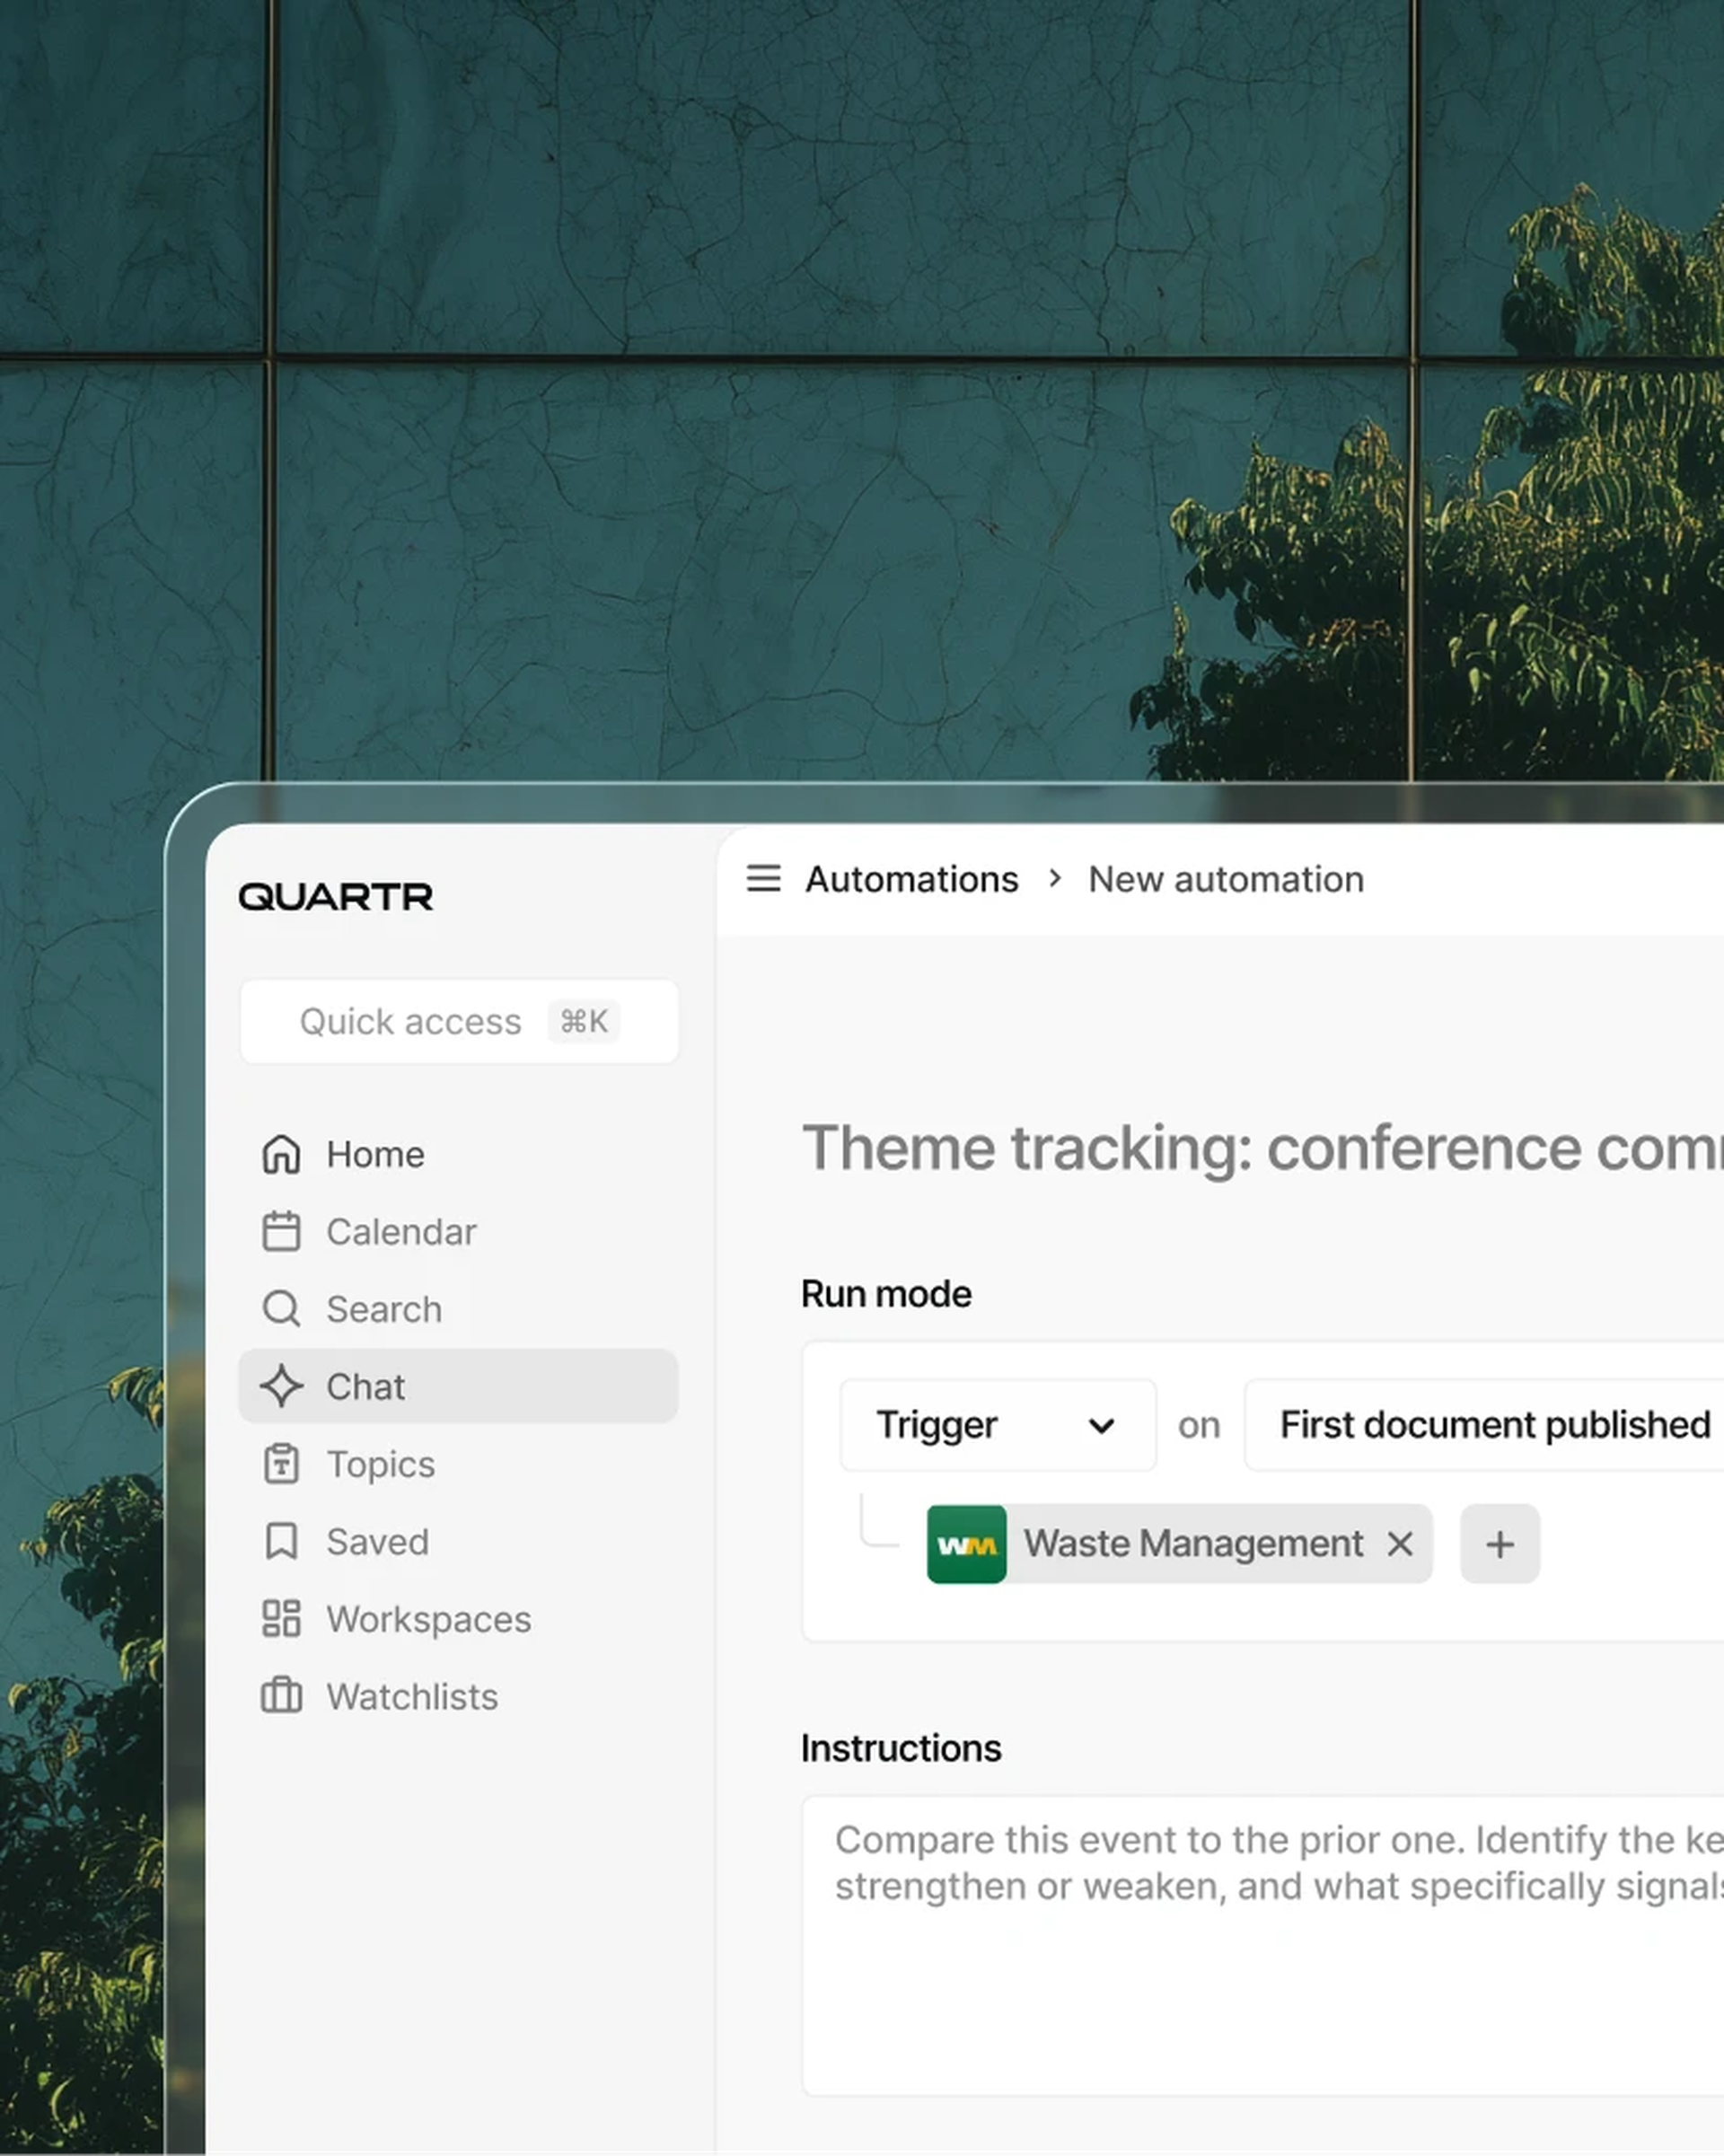
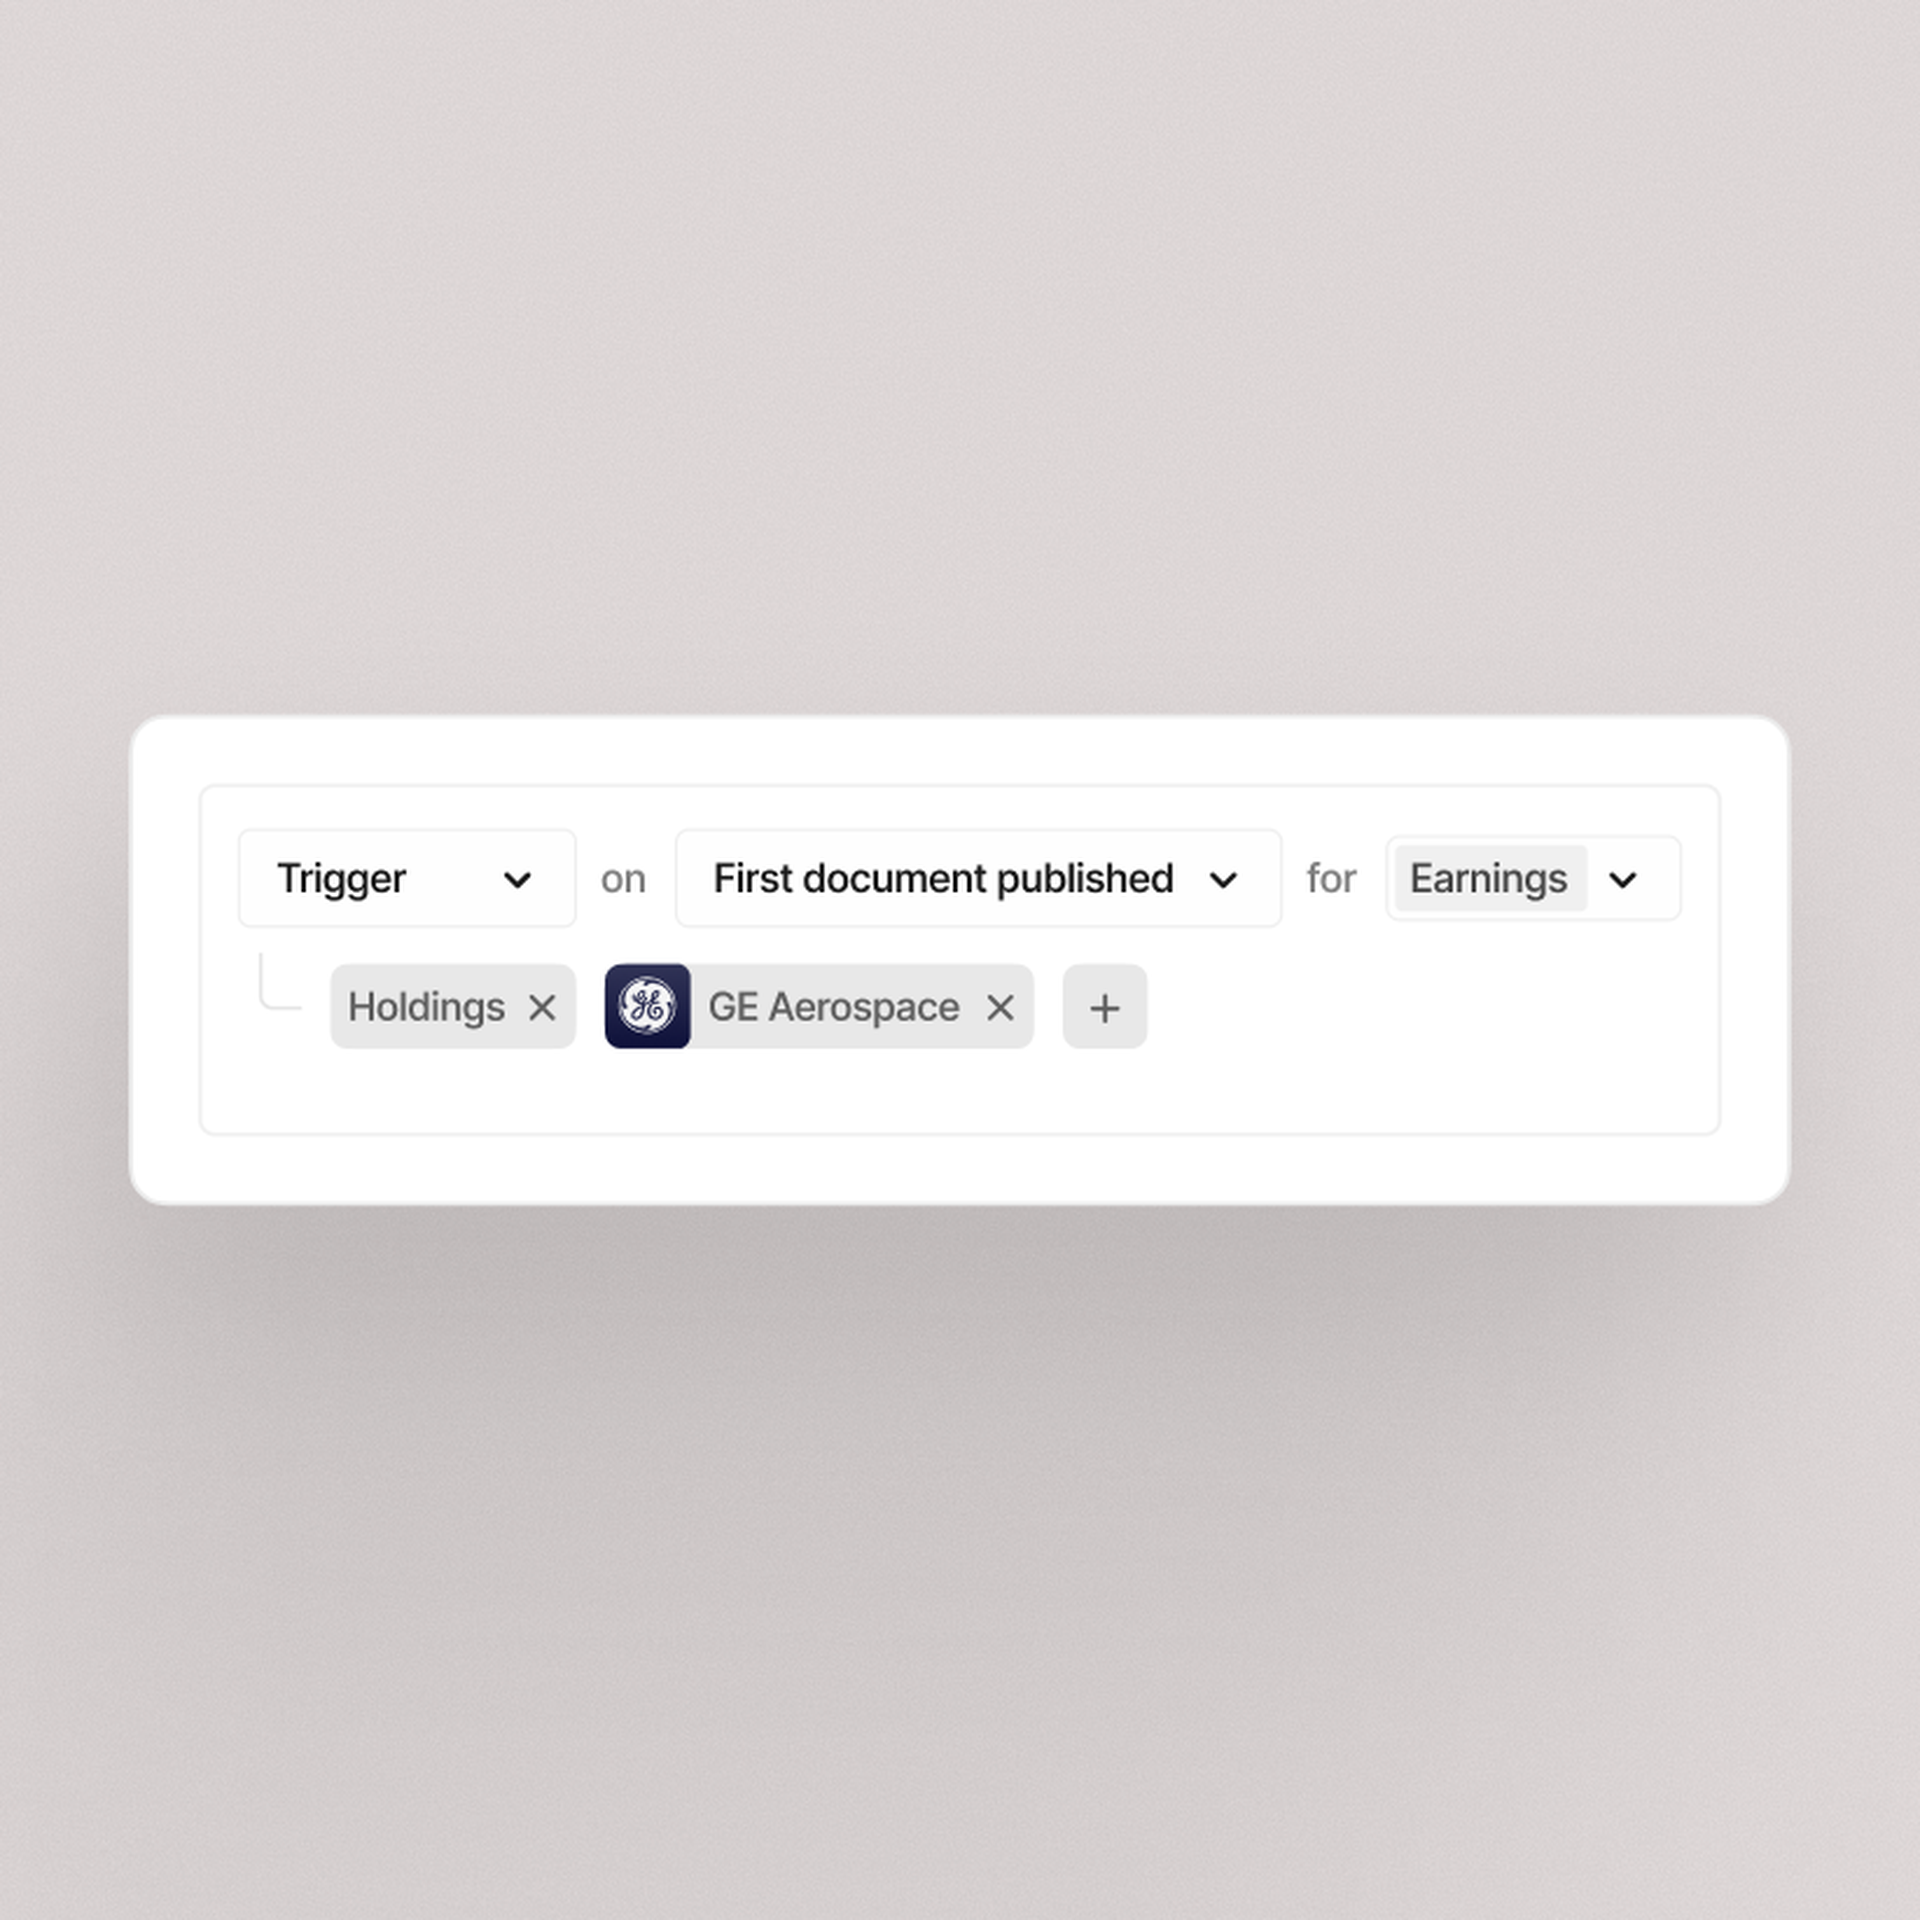
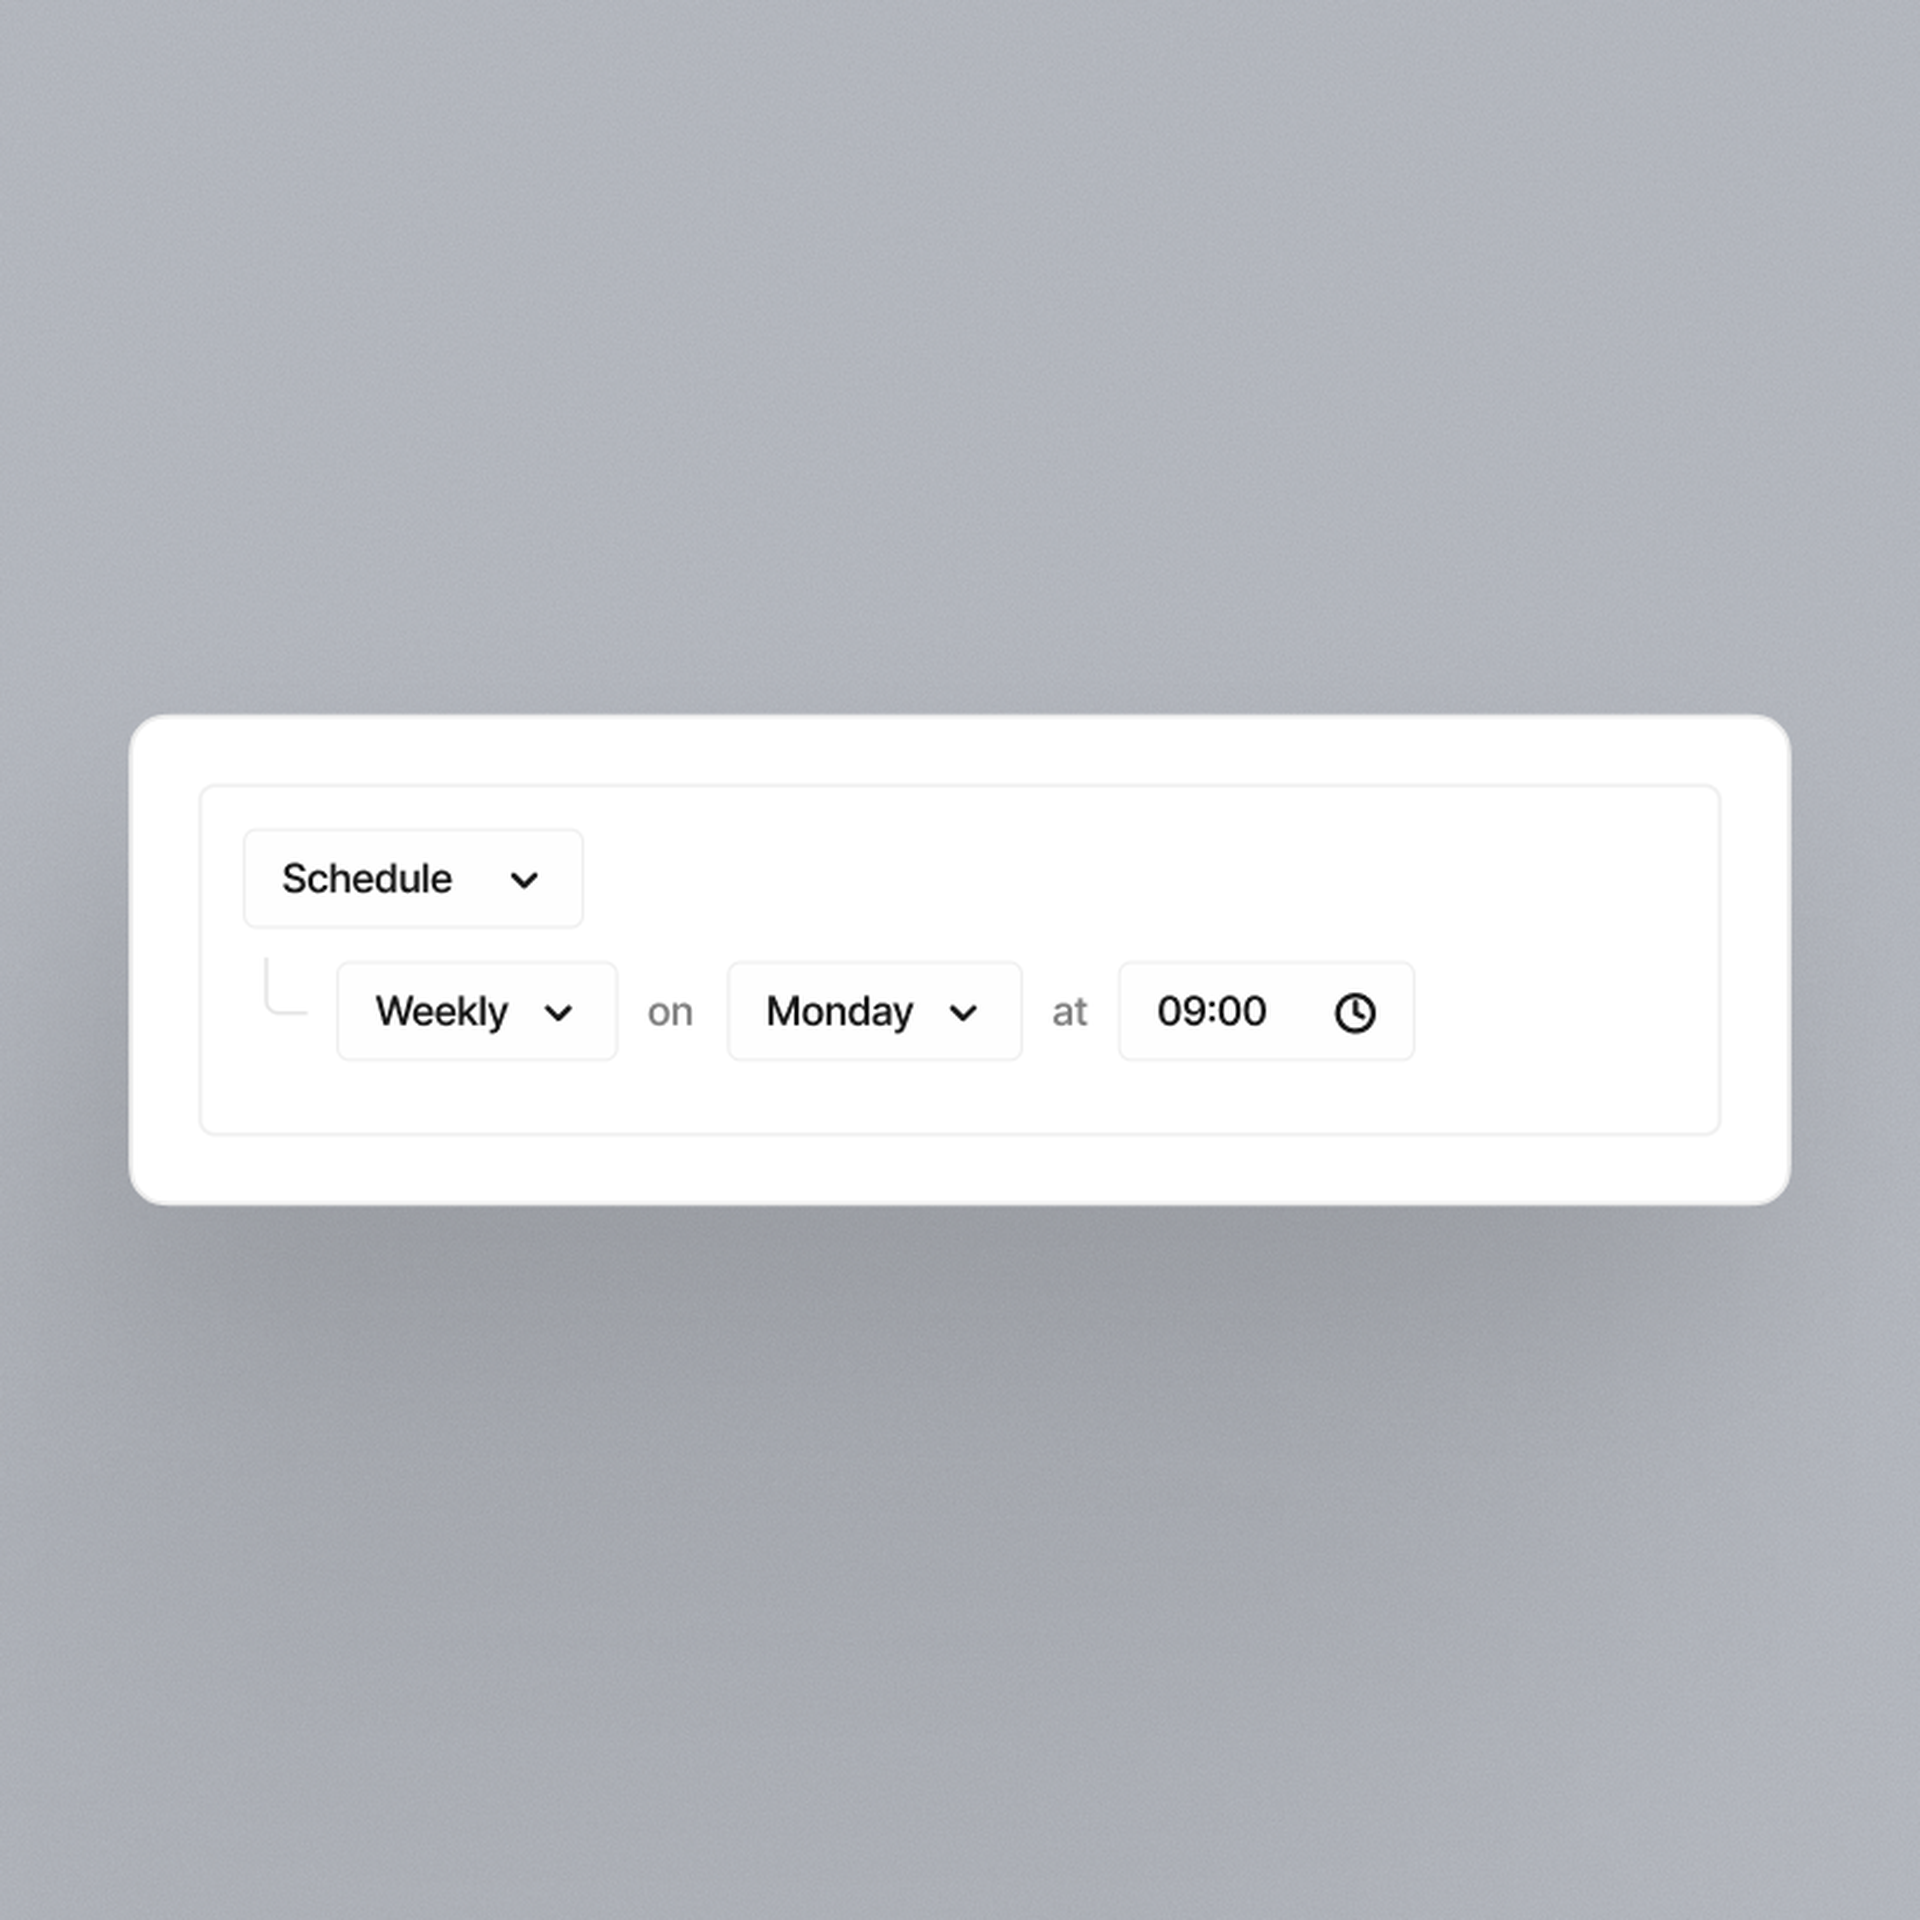
Automations
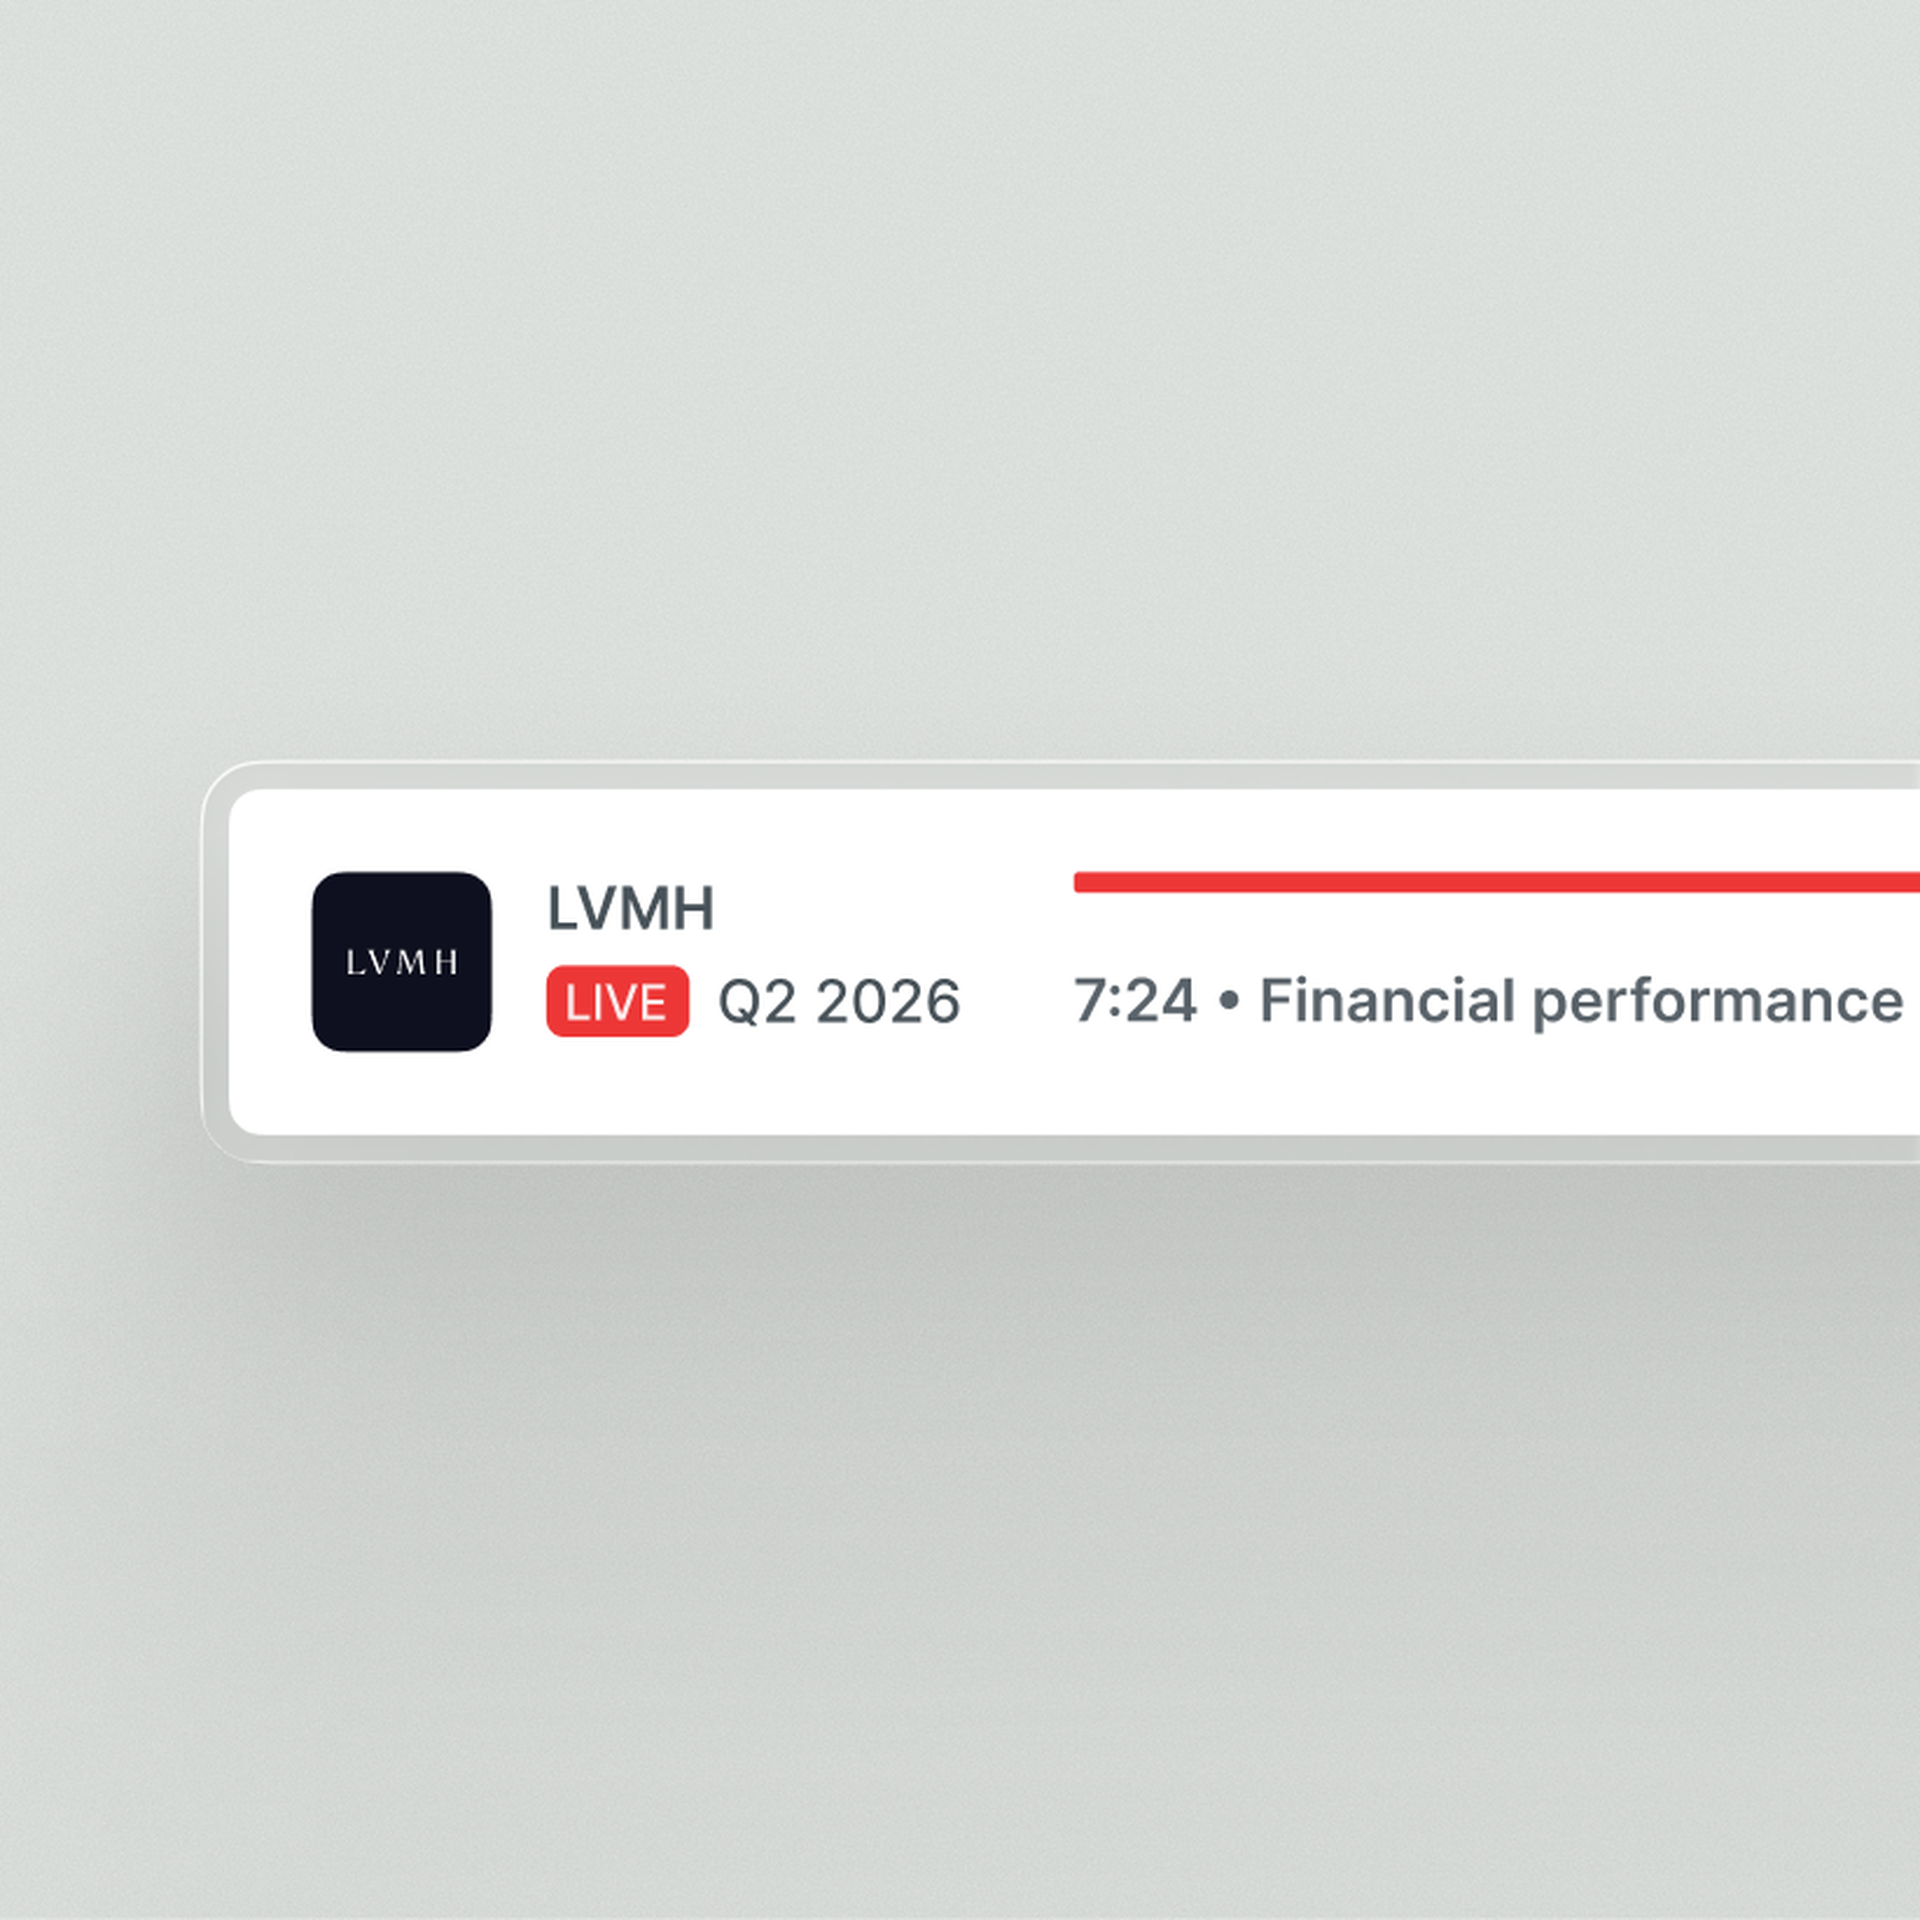
Live audio & transcripts
Quartr's AI stands out because it only pulls clean, first-party data from public companies. In investing, that's everything.
Jamie Ross
Investment Manager, GAM Investments
Research that used to take hours now takes seconds with Quartr Pro. Tracking shifts in tone or extracting tables, it's as simple as typing a query.
Tom O'Hara
Investment Director
Before Quartr we spent hours manually compiling insights through the peer earnings cycle. Now, these tasks are done faster, with greater precision.
Gregg Lampf
VP of Investor Relations
Being able to ask specific questions across years of transcripts and reports and instantly get verified answers is a game-changer.
Pontus Dackmo
CEO & Investment Manager