Company research17 Oct 2025
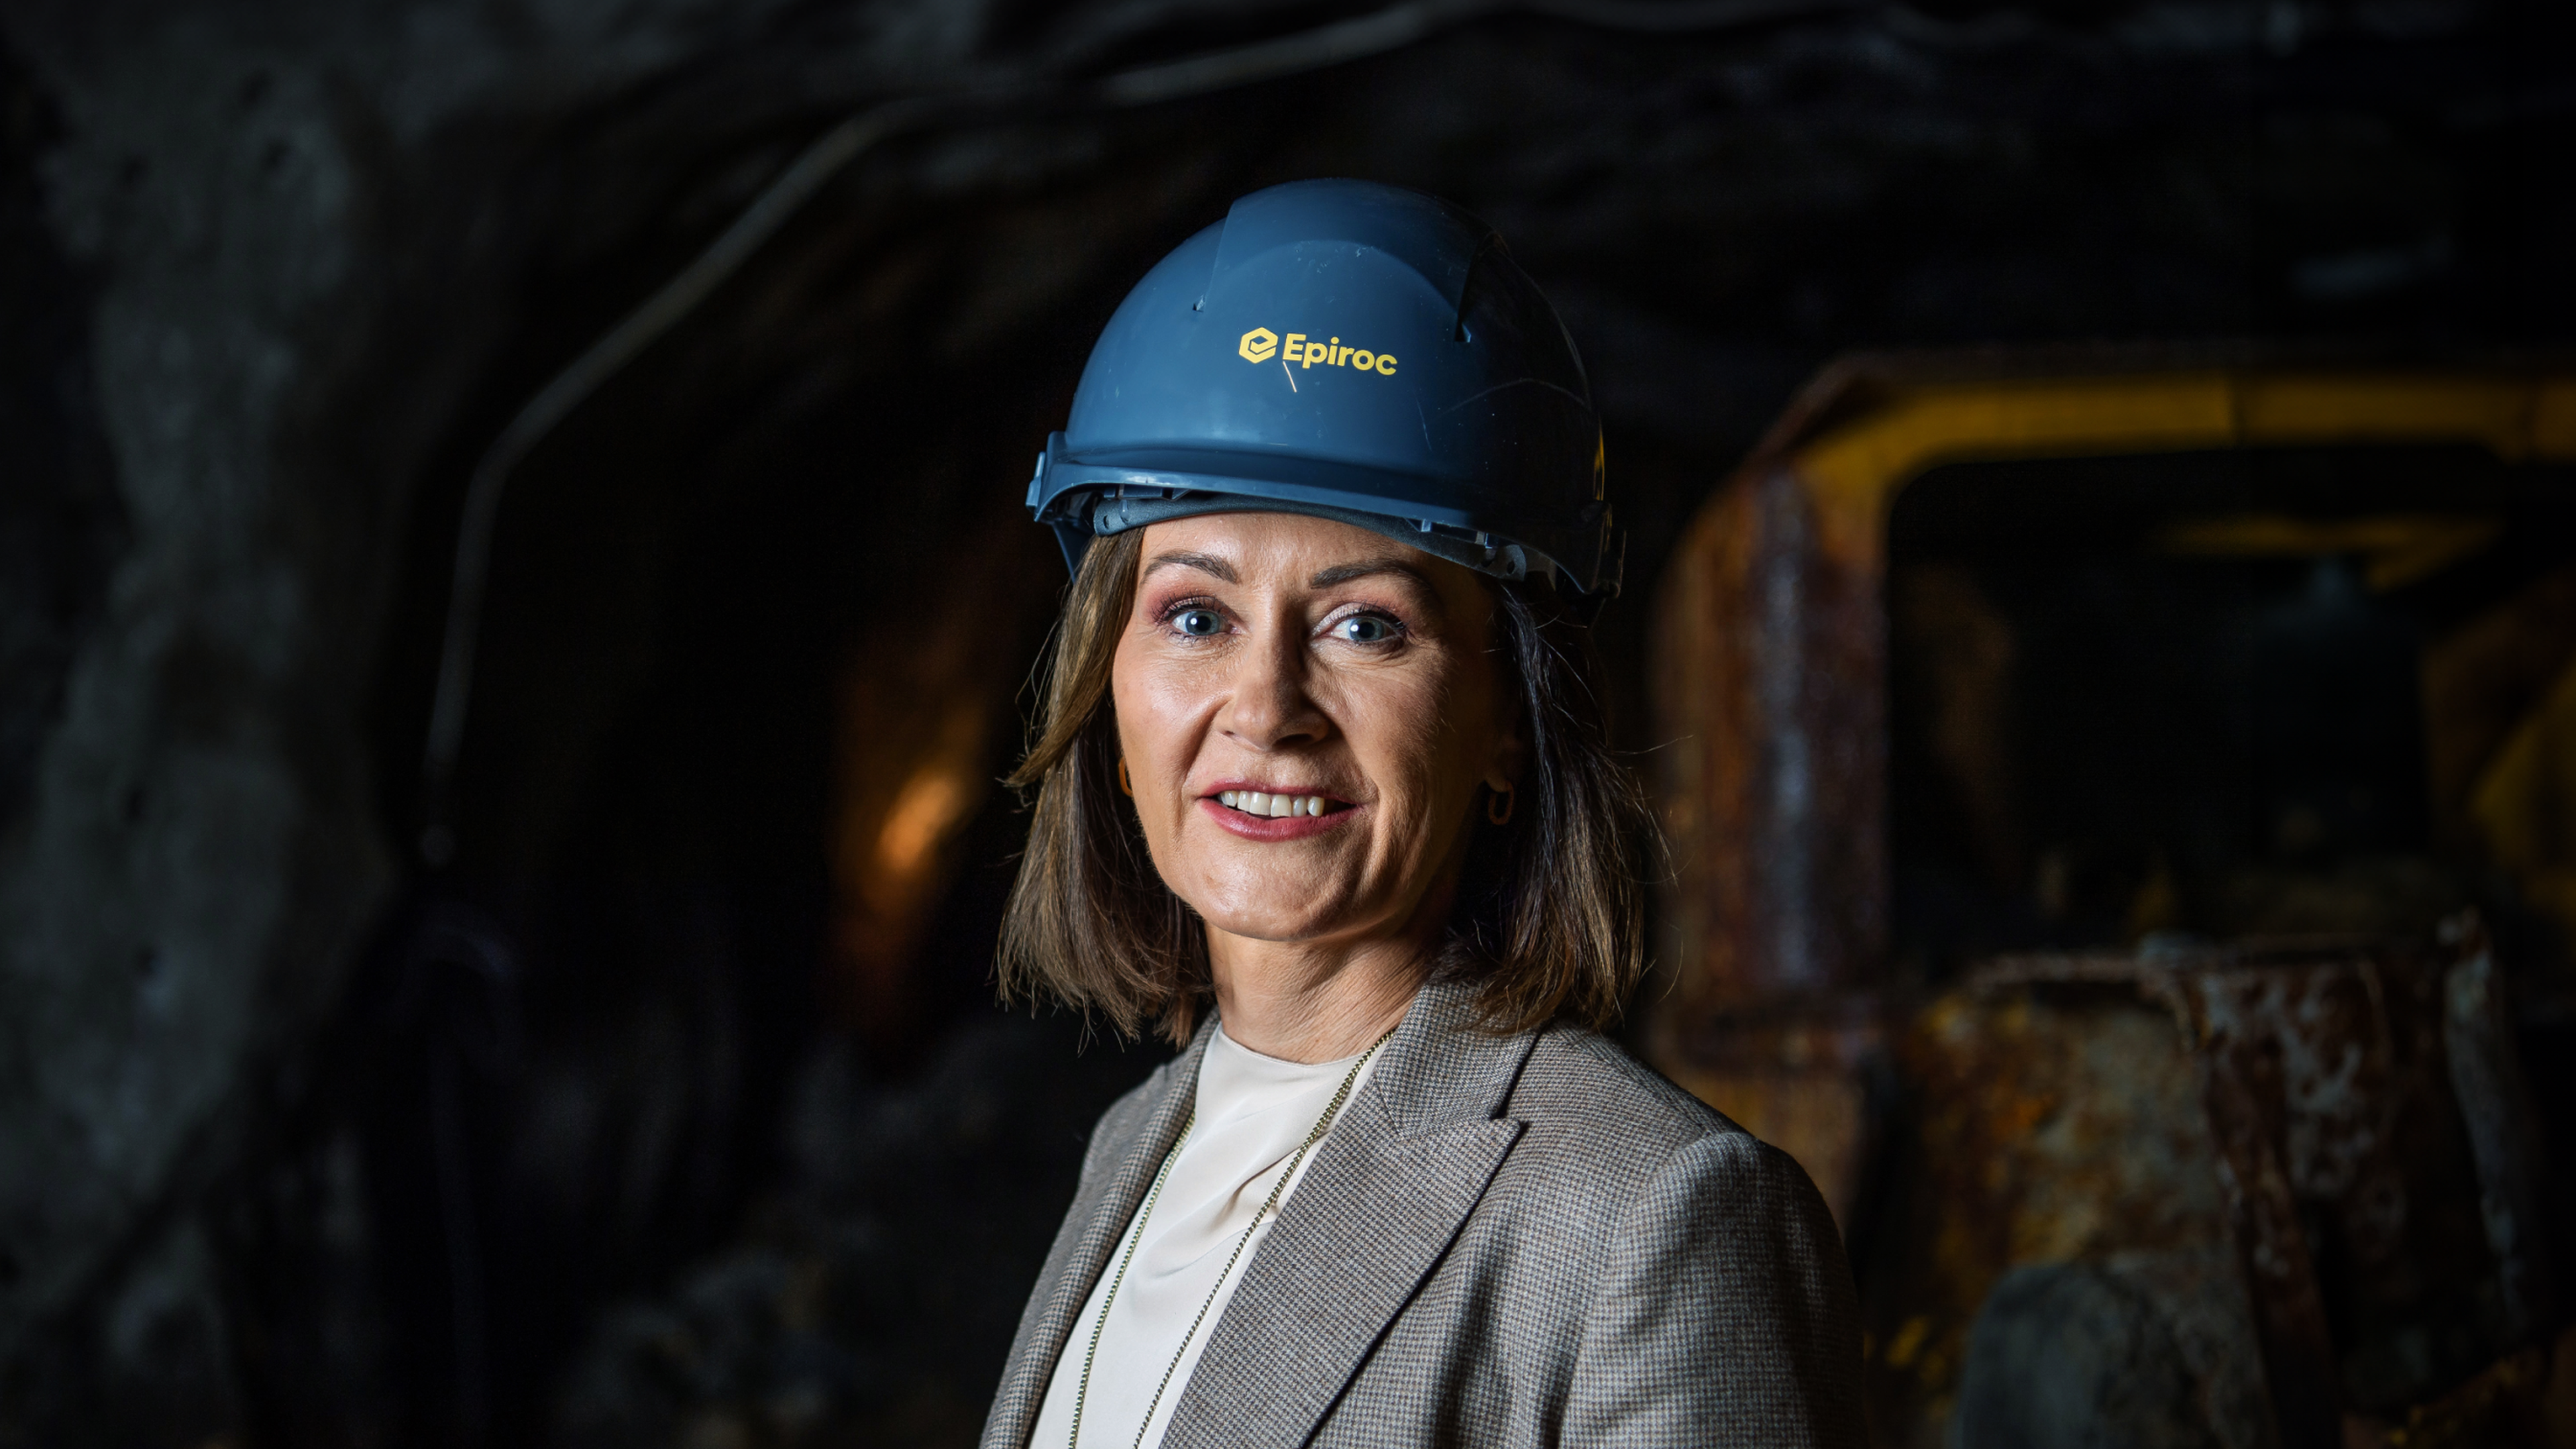
Beneath the Surface: A Conversation with Epiroc CEO Helena Hedblom
Legacy, innovation, and leading one of Sweden's most influential industrial companies into a new era.

Q3 continuing-operations revenue rose 7% YoY to $3.678B; adjusted operating profit increased 8% and adjusted diluted EPS rose 9% to $4.58.
Growth accelerated in Indices, Energy and Market Intelligence; Ratings growth moderated against tougher comparisons.
A strategic review is considering potential separation of Capital IQ and associated data businesses; scope and outcome remain uncertain.
GAAP operating profit rose 26% to $1.956B, including a $200M disposition gain; adjusted operating profit increased 8% to $1.969B.
GAAP diluted EPS from continuing operations was $4.45, up 26%; adjusted diluted EPS was $4.58, up 9%.
Adjusted expenses rose 5%; adjusted operating margin expanded 60 bps YoY to 53.5%.
Benchmark product revenue increased 7%; enterprise recurring revenue rose 8%.
Nine-month operating cash flow from continuing operations was $3.661B; free cash flow was $3.299B, up 12% YoY.
FY26 organic constant-currency revenue growth guidance rose to 7.5%–8.5%; adjusted EPS guidance increased to $17.70–$17.95.
FY26 adjusted margin expansion guidance is 75–100 bps, or 125–150 bps excluding OSTTRA; GAAP revenue growth guidance is 7.4%–8.4% and GAAP diluted EPS guidance is $16.25–$16.50.
Division organic constant-currency growth guidance: Ratings 6.5%–8%, Indices 17%–18.5%, Energy 4.5%–6%, and Market Intelligence 5.5%–7%.
Ratings billed issuance is expected to grow at a high-single-digit rate; M&A-related issuance growth assumption rose to 20%–30%.
Energy subscription growth is expected to improve in Q4; Q4 adjusted free cash flow is expected at ~$1.6B.

AI chat
Automations
Live audio & transcripts
Quartr's AI stands out because it only pulls clean, first-party data from public companies. In investing, that's everything.
Jamie Ross
Investment Manager, GAM Investments
Research that used to take hours now takes seconds with Quartr Pro. Tracking shifts in tone or extracting tables, it's as simple as typing a query.
Tom O'Hara
Investment Director
Before Quartr we spent hours manually compiling insights through the peer earnings cycle. Now, these tasks are done faster, with greater precision.
Gregg Lampf
VP of Investor Relations
Being able to ask specific questions across years of transcripts and reports and instantly get verified answers is a game-changer.
Pontus Dackmo
CEO & Investment Manager


S&P Global is a provider of financial information and analysis, offering a broad range of services to various stakeholders worldwide. Central to its portfolio is a collection of ratings, benchmarks, and data-driven insights, catering to investors, businesses, and governments. Notably, the firm is responsible for the S&P 500 index, which aggregates the performance of 500 significant publicly traded companies in the U.S. The index is widely regarded as a key gauge for the U.S. stock market and offers insights into the country's economic trends. Beyond the iconic index, S&P Global provides a suite of other products and services that play an important role in the global financial ecosystem.
S&P Global, originally founded as the Standard Statistics Bureau, began its journey by tracking the financial performance of U.S. companies. In 1941, the company merged with Poor's Publishing, an entity that had been detailing the history of railroads and other industrials since 1888, leading to the creation of Standard & Poor's. Over the decades, it evolved into one of the world's leading financial market intelligence providers. Renowned for its stock market indices, especially the S&P 500, the company expanded its services to include credit ratings, research, and benchmarks. In 2016, to reflect its broadened services and global reach the company rebranded as S&P Global.
The S&P 500 is one of the most widely followed and recognized stock market indices in the world. Established in 1957, it comprises 500 of the largest publicly traded companies in the U.S., capturing approximately 80% of the country's total market capitalization. As a market-capitalization-weighted index, the largest companies have the most influence on its movement. The S&P 500 serves as a key barometer of U.S. equity performance, reflecting the health of the U.S. economy and broader market trends. Financial professionals, such as investment banks as well as retail investors use it as a benchmark.
S&P Global is far more than just the S&P 500. The company is a provider of transparent and independent ratings, benchmarks, analytics, and data. S&P Global Ratings provides credit ratings that help investors assess risks associated with debt instruments. The Global Market Intelligence division offers insights into the finance and commodities sectors. S&P Global Platts is pivotal in providing information and benchmarks for the energy and commodities markets. Meanwhile, S&P Dow Jones Indices create indices that cover a wide range of financial markets and companies. However, it’s not alone in doing so, and when looking at some publicly traded companies providing indices we find MSCI and Nasdaq.