)
Investor relations5 Jul 2024
Quartr AI Assistant: Do Hours of Work in Seconds
Quartr AI assistant revolutionizes finance by providing accurate, reliable insights from first-party data, streamlining complex tasks.
In today’s digital era, where information is overflowing but attention spans are short, making informed investment decisions can be tricky. Quartr aims to simplify this process for investors and analysts with our 'Key Slides' feature, offering a fresh approach to accessing the most important company-specific details.
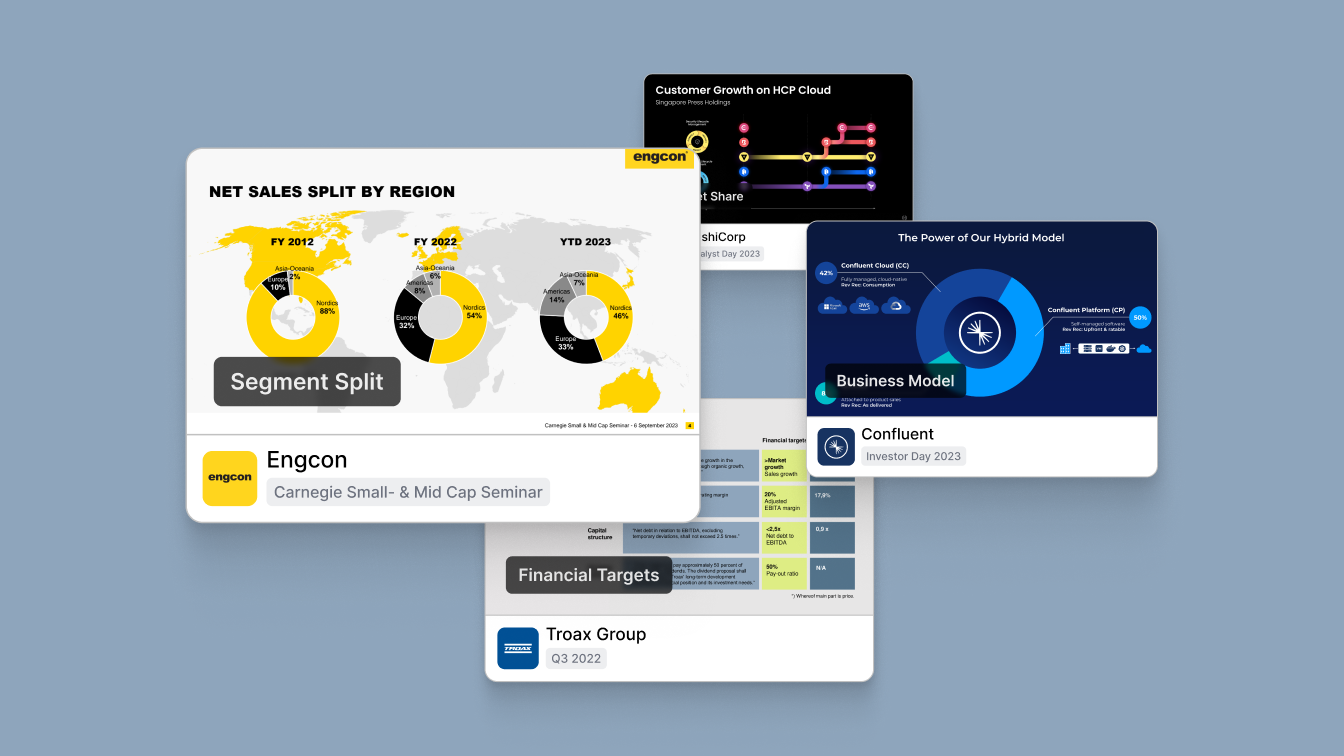
With the ever-growing volume of information available, it has become increasingly challenging to sift through the noise and determine which pieces truly matter. This challenge inspired us to develop Key Slides. This tool enables users to quickly grasp the narrative companies present to the market by showcasing the most valuable company-specific information on the company pages in Quartr Pro.
Through a carefully designed ranking system, complemented by a trained AI model, the system efficiently filters out the most critical and relevant information from public companies. This streamlining makes it effortless for investors, analysts, journalists, and other stakeholders to grasp the essentials of specific businesses in no time.
What makes Key Slides stand out is its focus on highlighting companies' most telling slides. These slides are curated to ensure they communicate the heart of a company's narrative. By presenting visual data on pivotal attributes like business models, outlooks, and capital allocation frameworks, users get a fundamental understanding of specific companies in just a few minutes.
Visual learners will appreciate how much easier it is to process a well-designed slide communicating intricate financial metrics, compared to reading paragraphs of text. It's about making data digestible, understandable, and actionable, which lies at the heart of everything we do at Quartr.
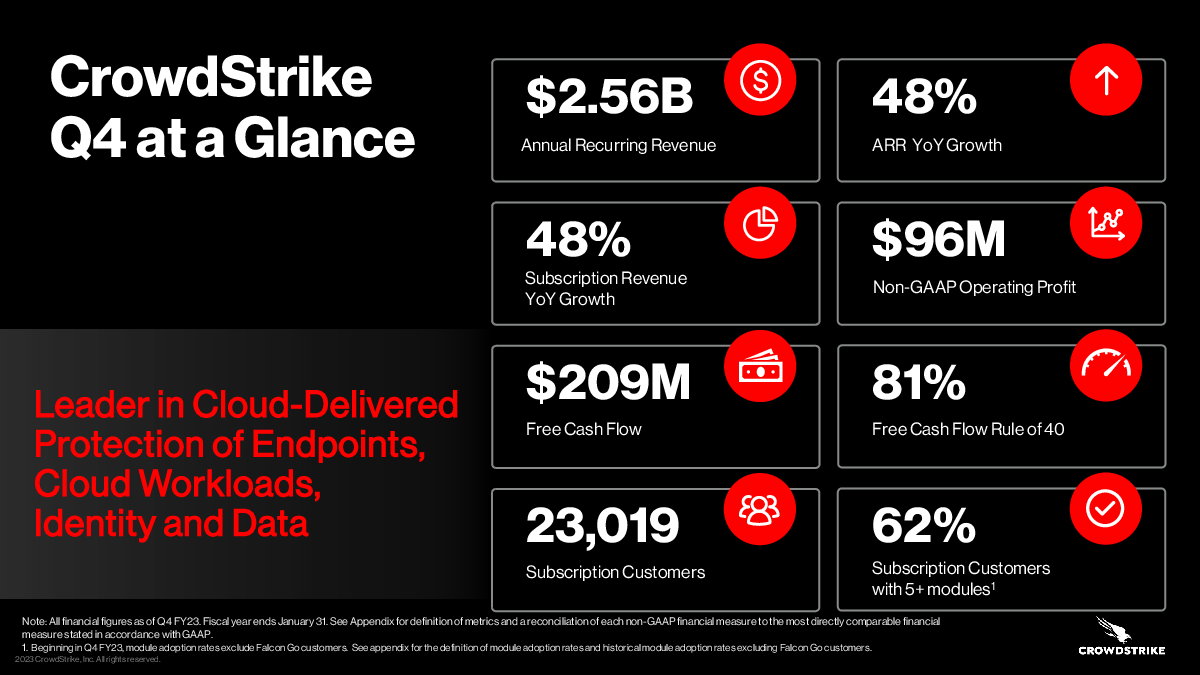
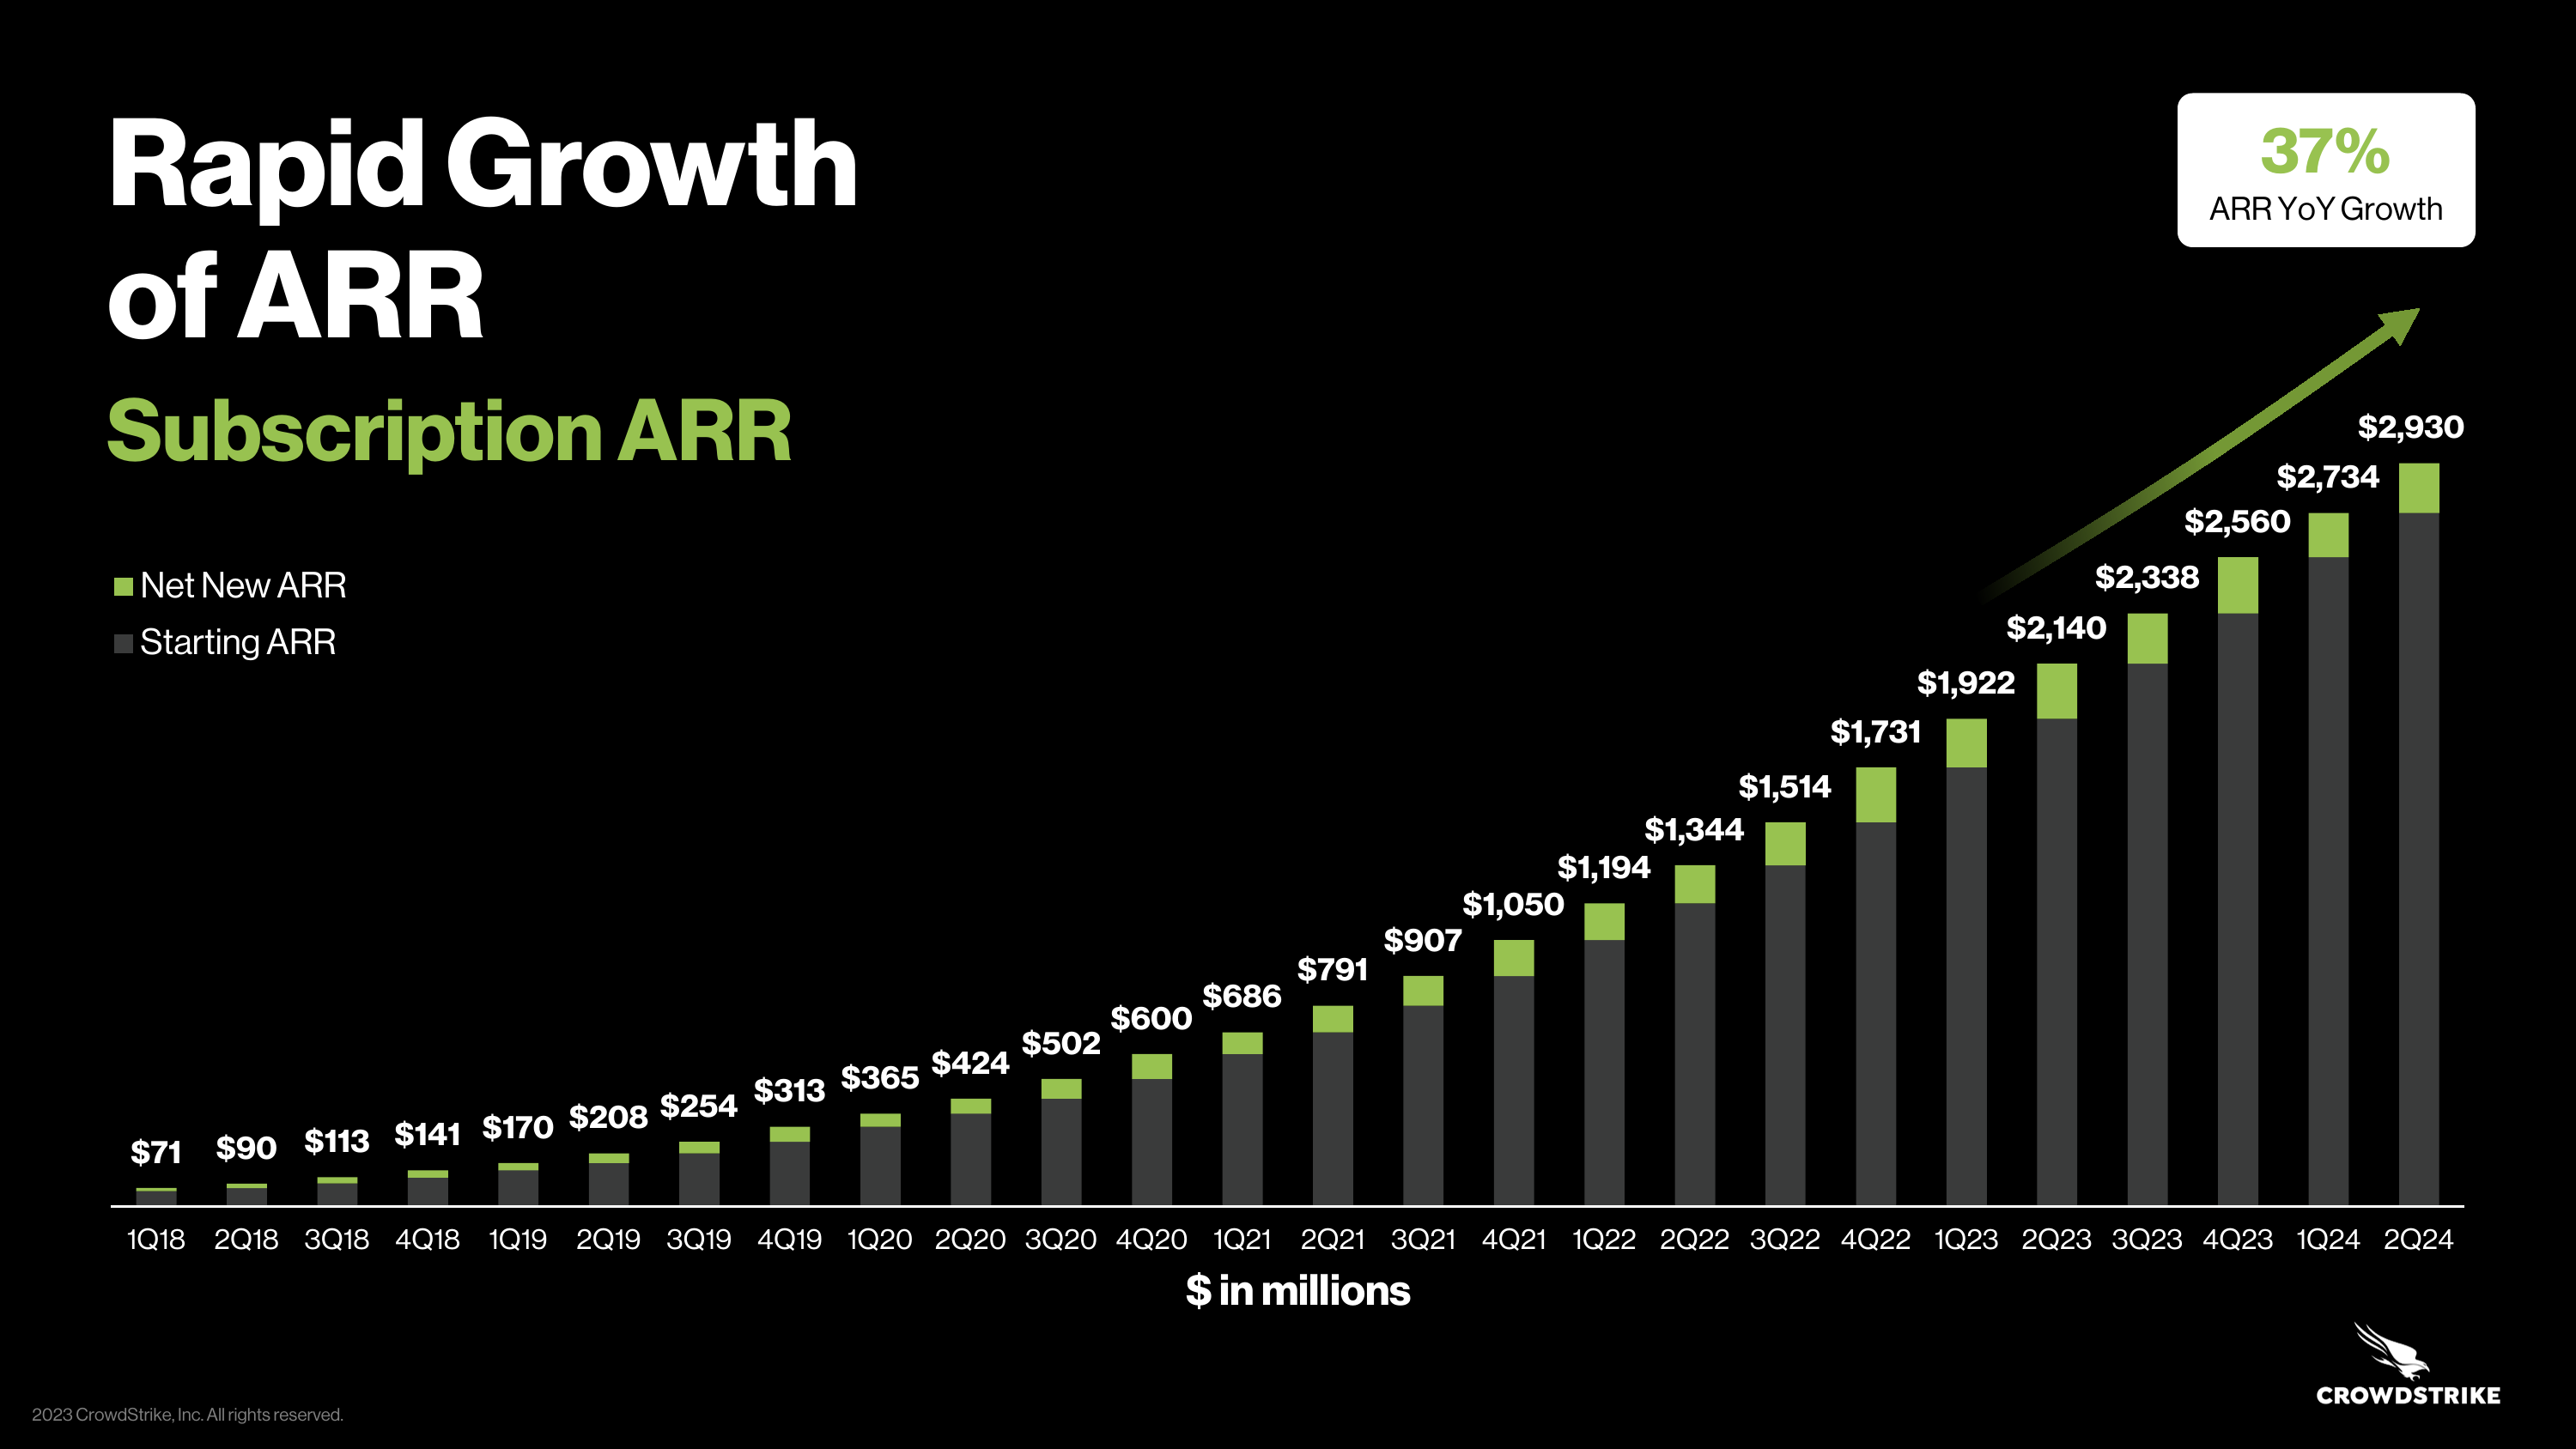
To better understand the value proposition, let's look at two examples of Key Slides from the cybersecurity giant, CrowdStrike. No longer must you sift through numerous pages and reports to obtain such insights.
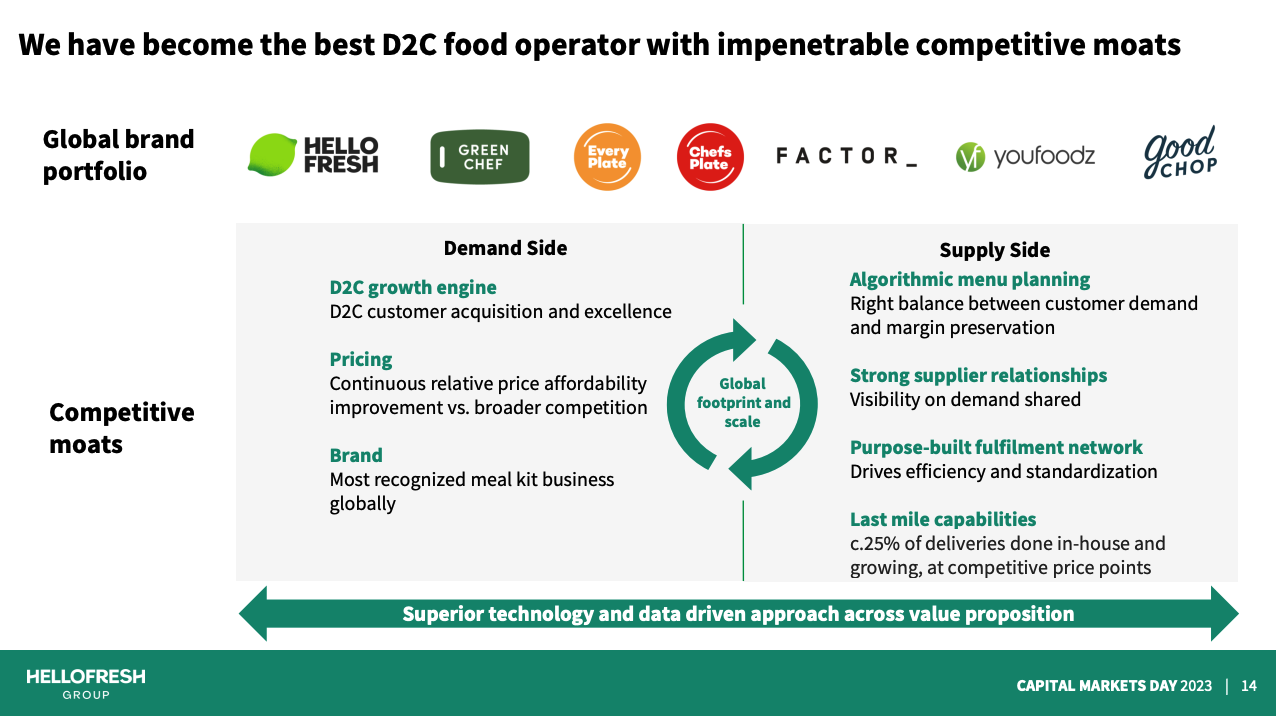
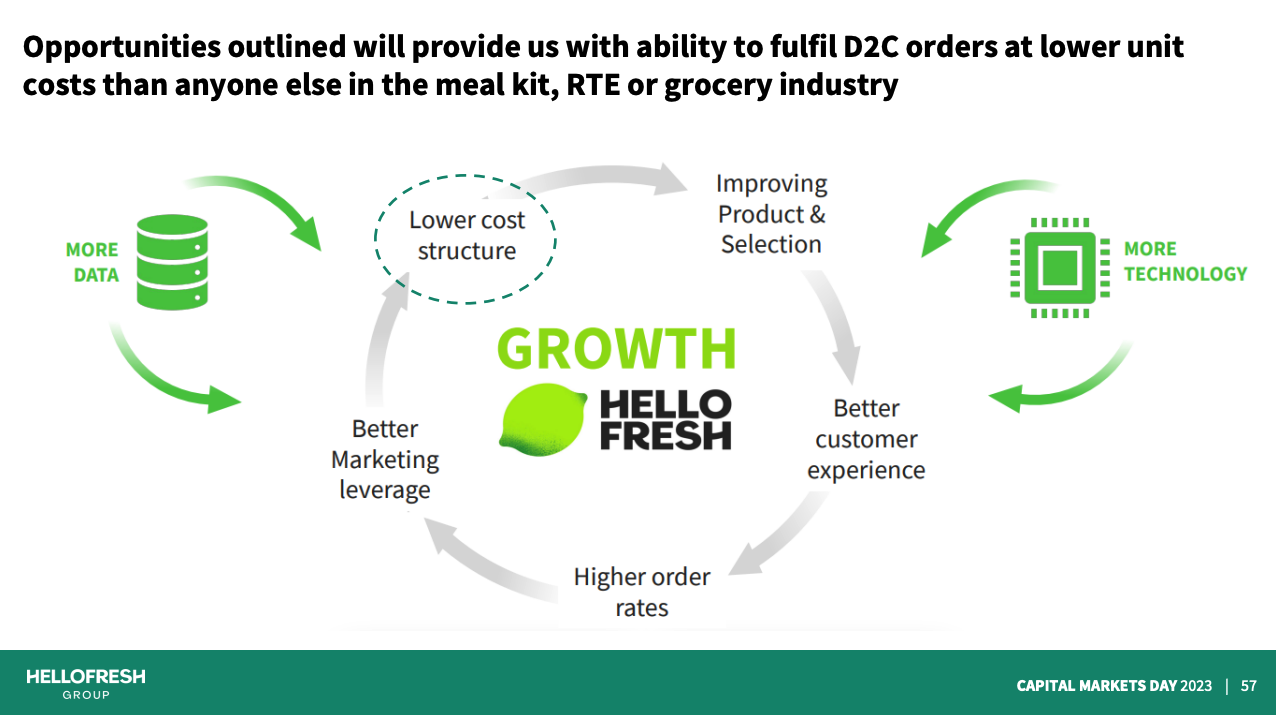
Another example of beautiful Key Slides that properly describe a business at its core is produced by the global meal-kit market leader, HelloFresh. Its business model, combined with its flywheel (or virtuous cycle) and market leadership, are arguably the most vital aspects to understand regarding HelloFresh as a business and its future. So, by simply searching for HelloFresh in Quartr Pro, entering its company page, and reviewing its Key Slides section, you can grasp the narrative of this German growth company in minutes, if not seconds. See for yourself:
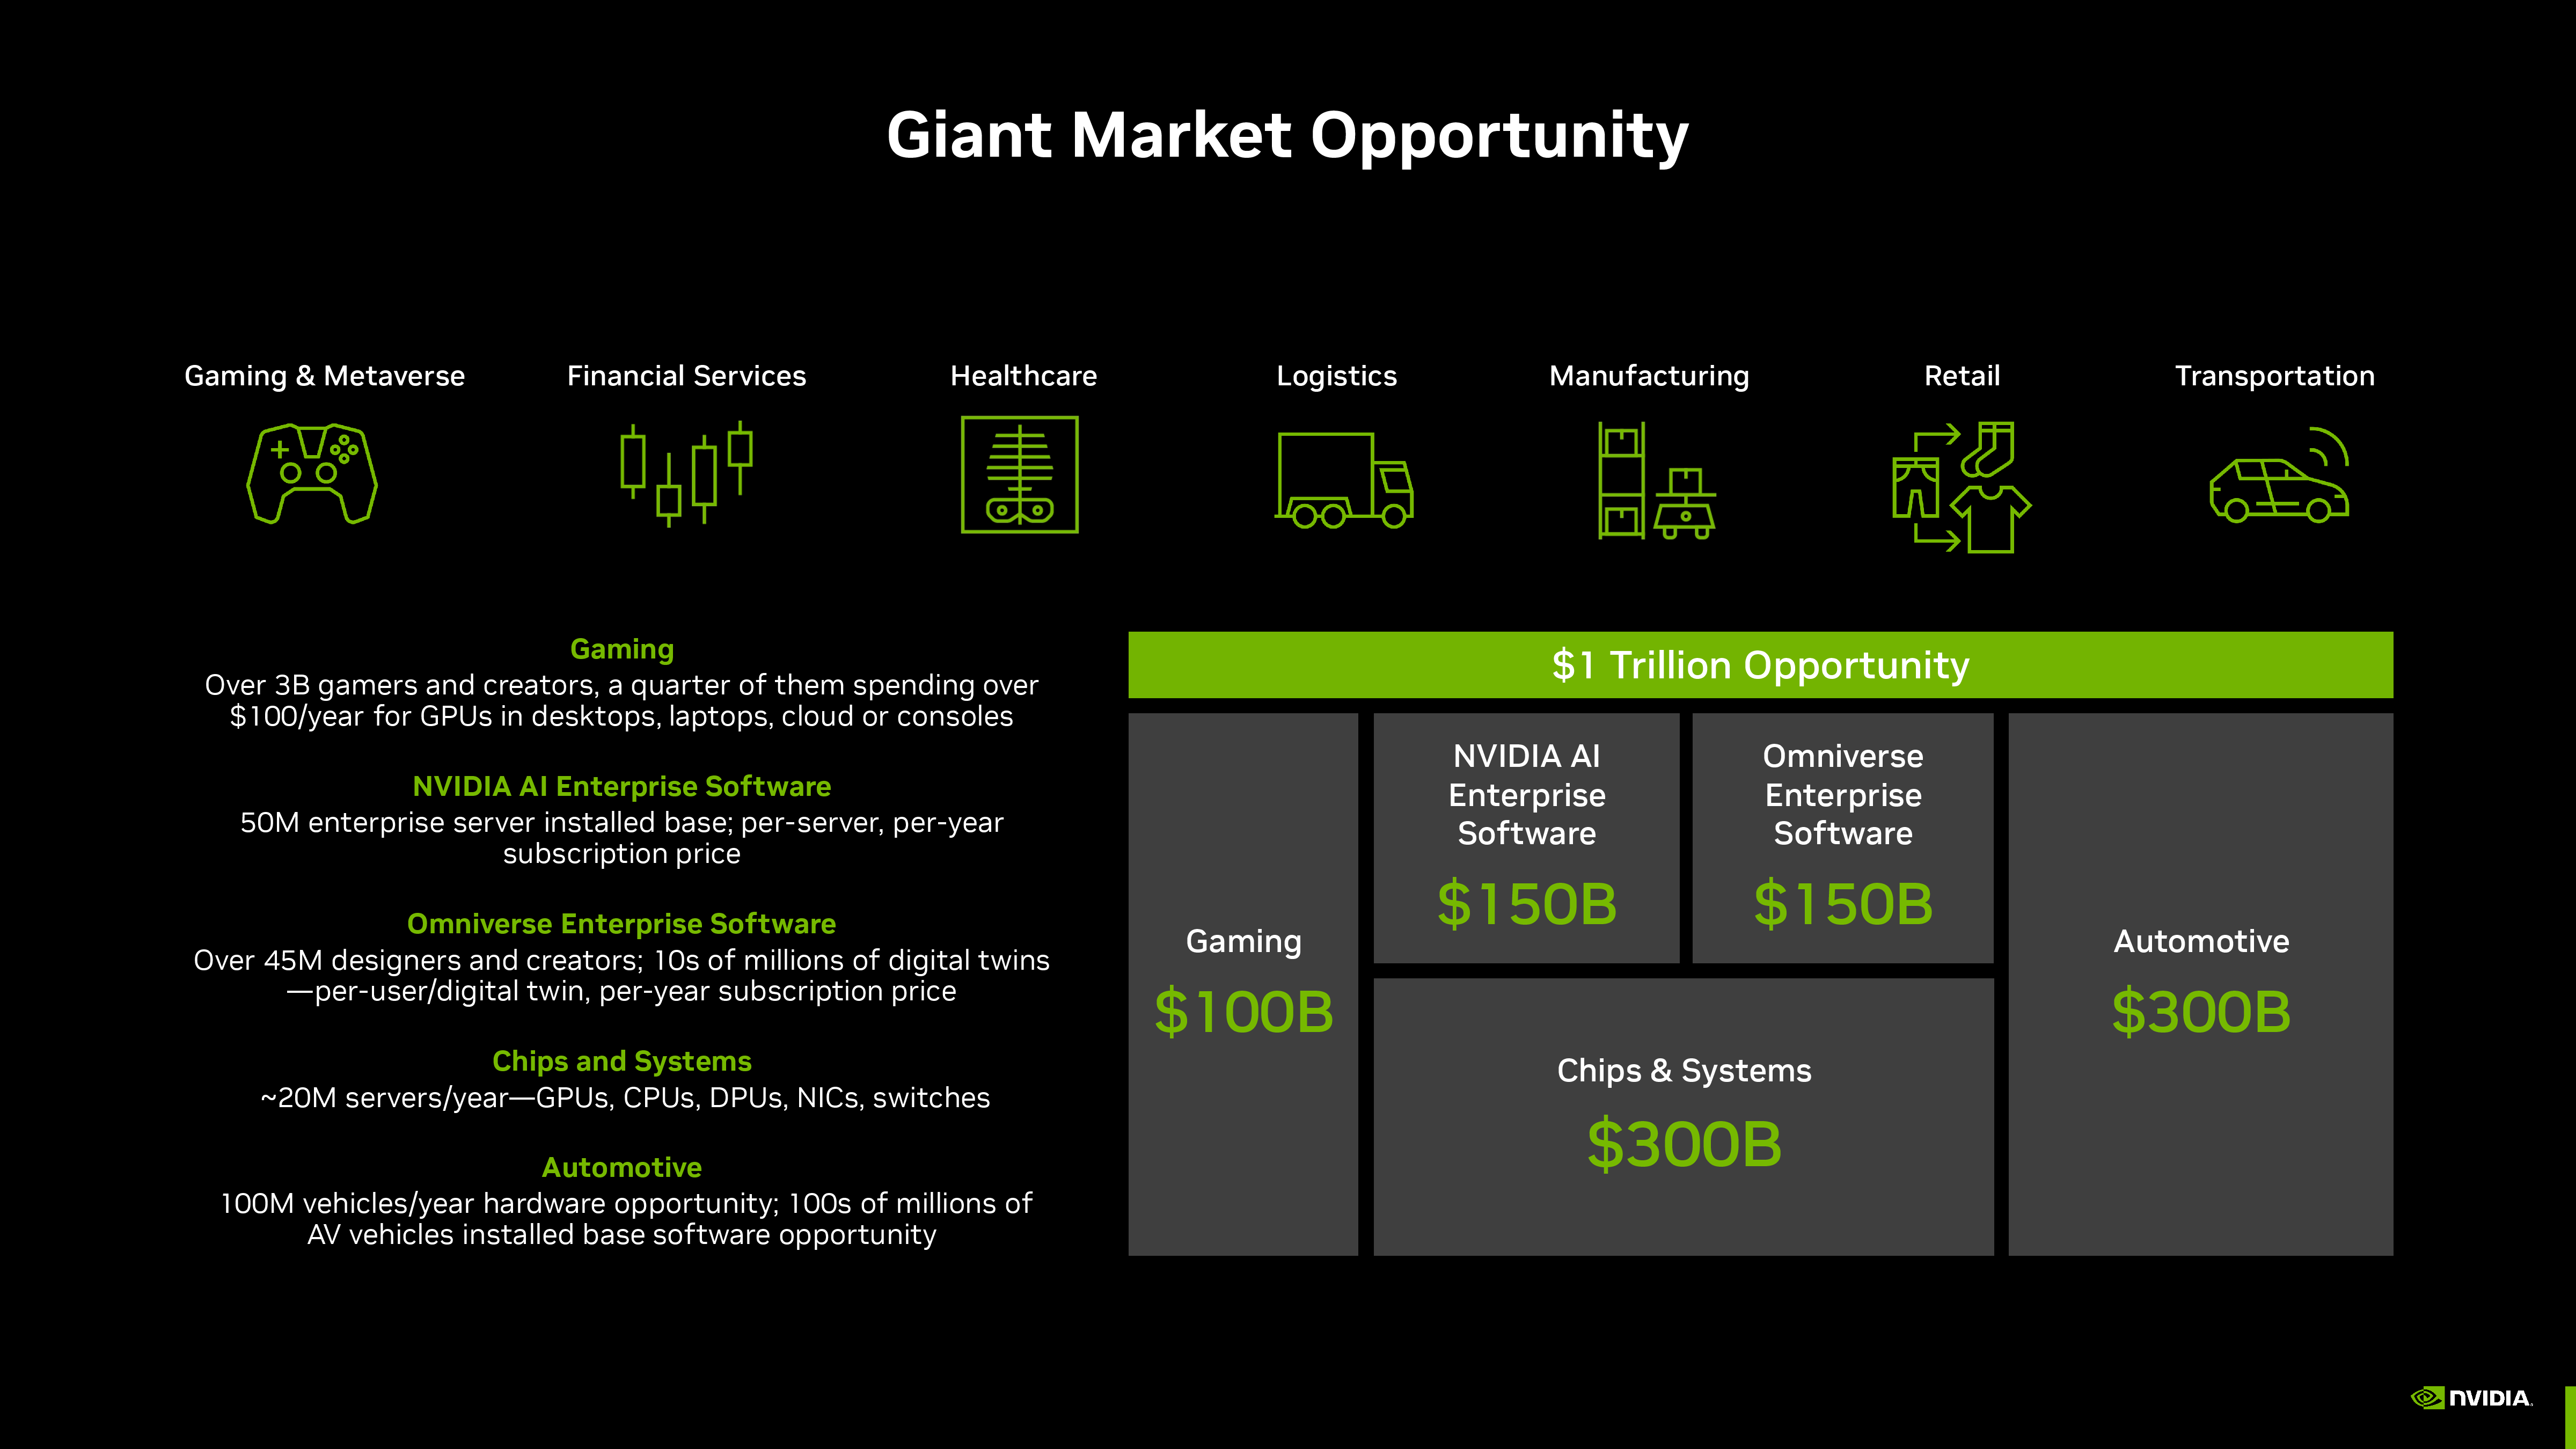
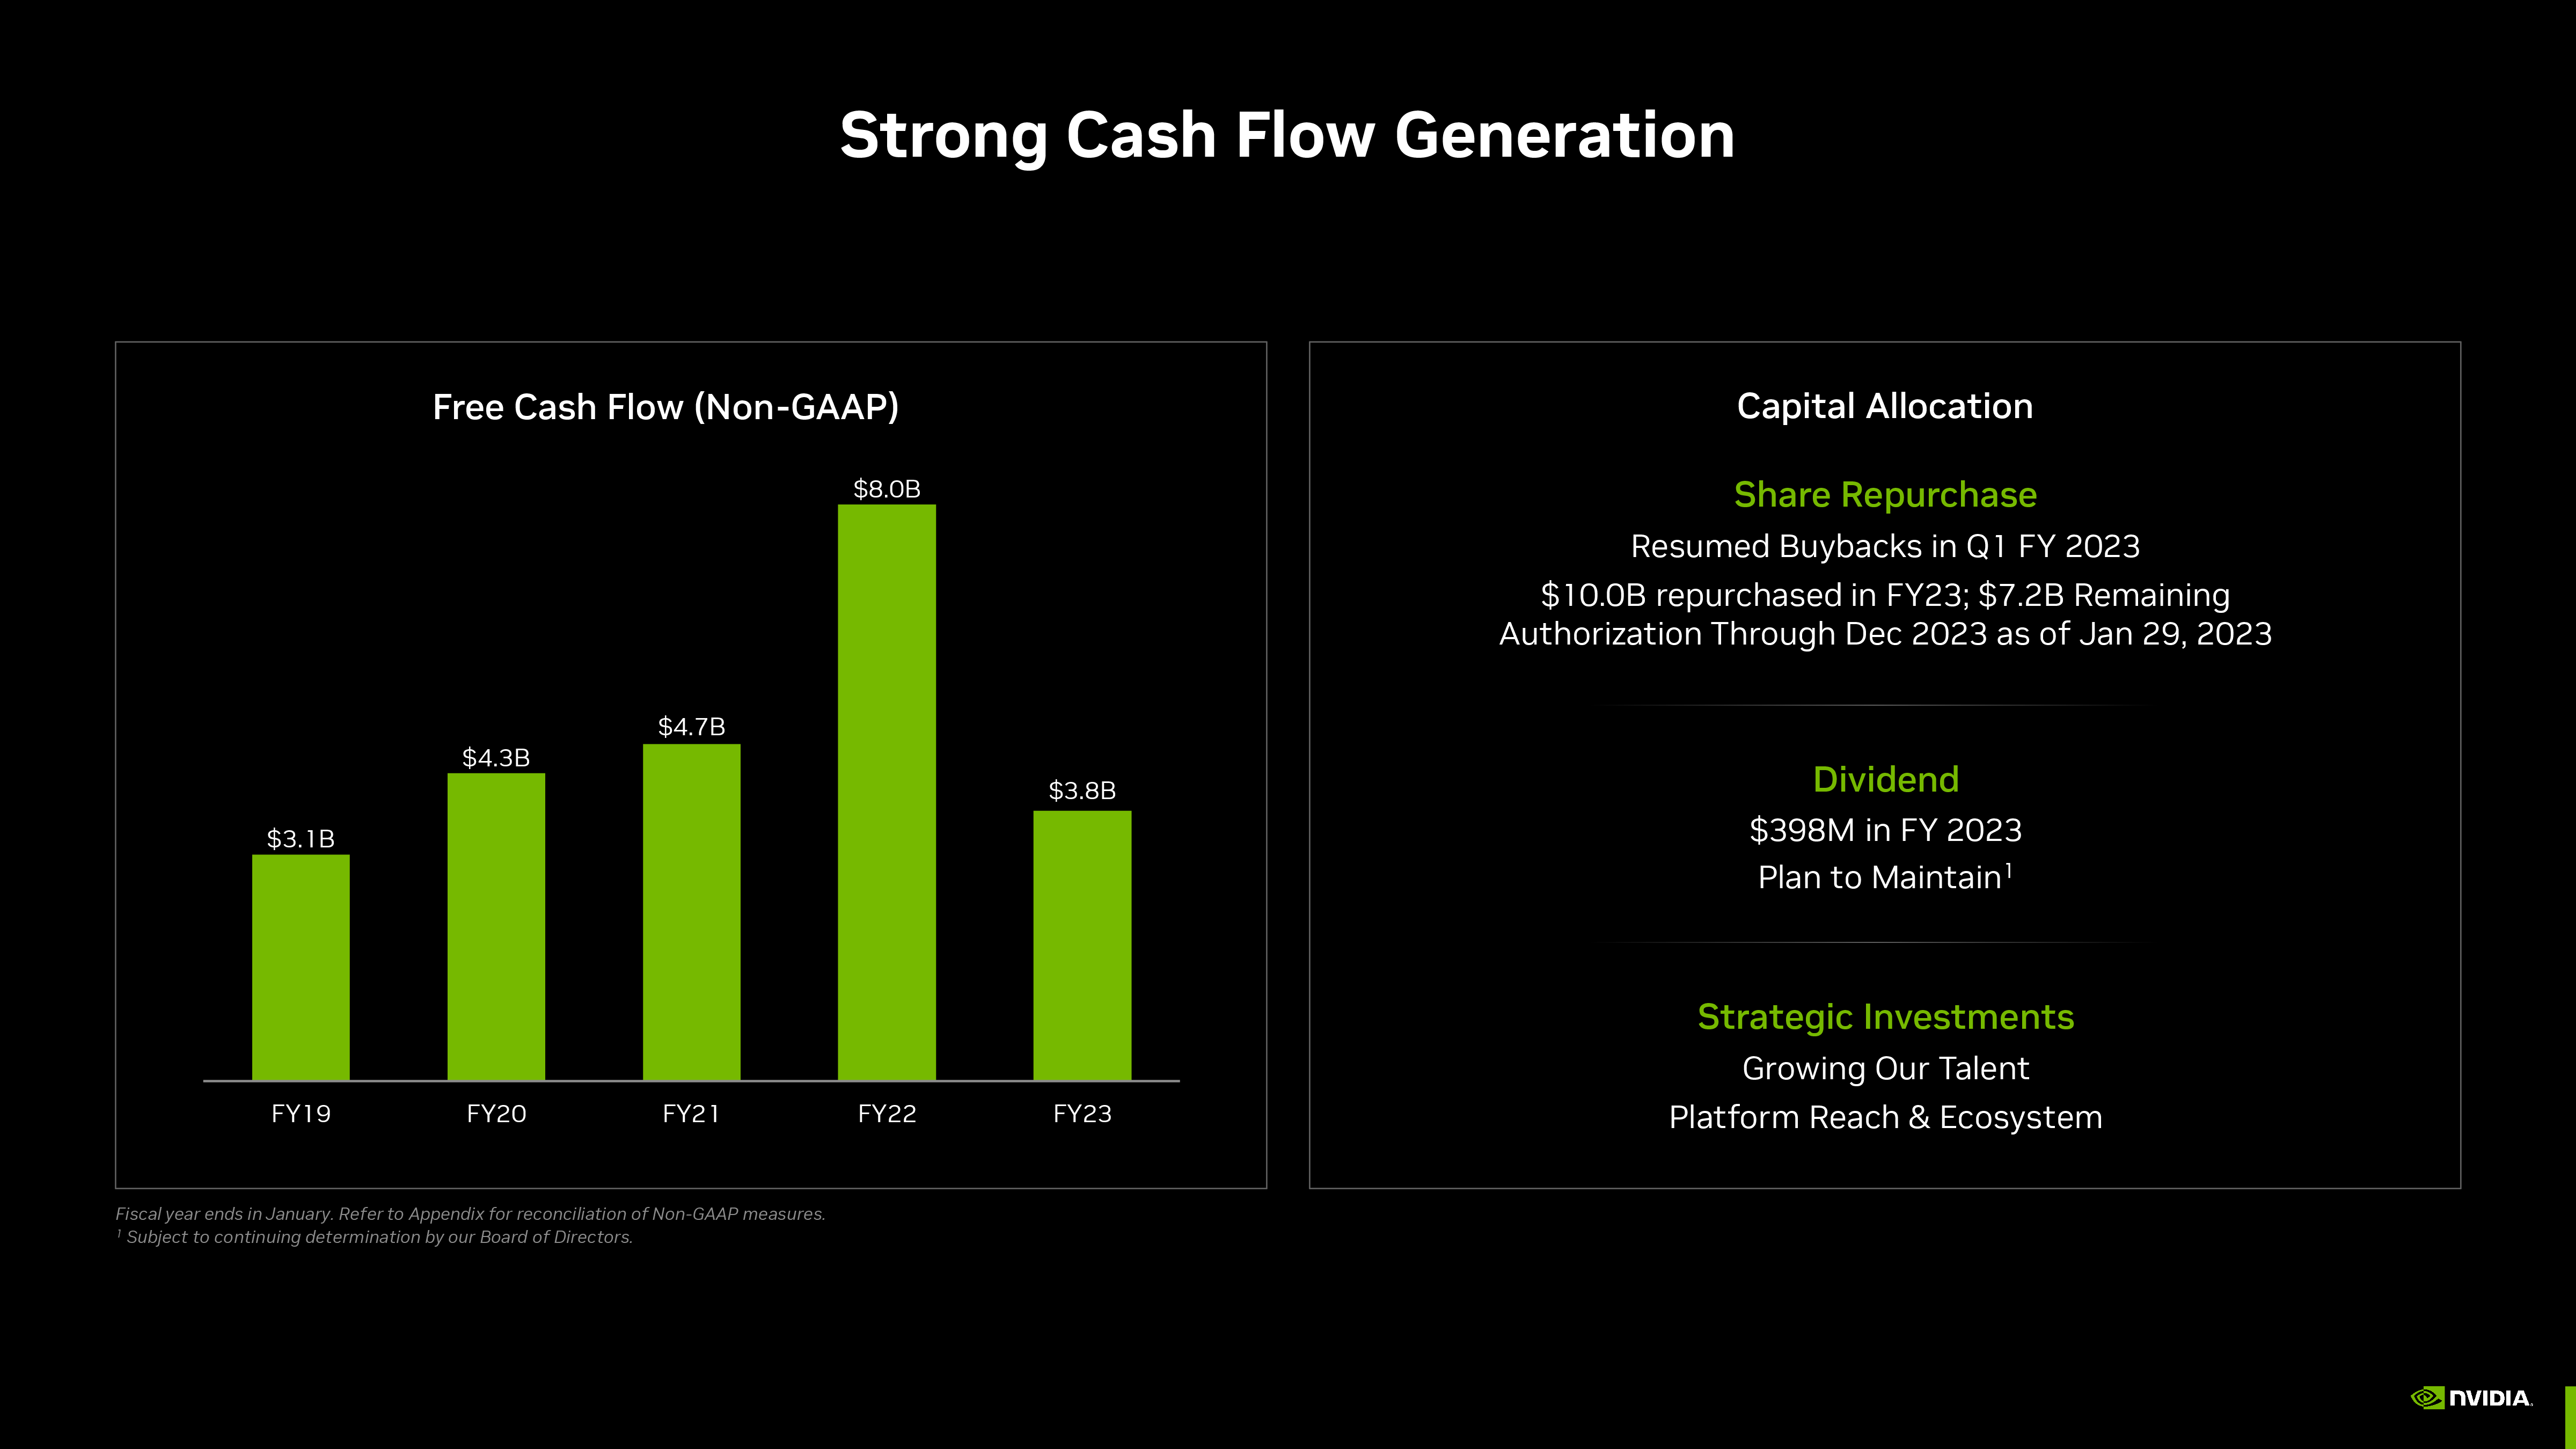
The final example of a company with captivating Key Slides is NVIDIA. Many investors find it challenging to understand NVIDIA due to its cutting-edge technology. However, by simply glancing at the Key Slides section, investors and other stakeholders can immediately gain an understanding of what NVIDIA perceives as its market opportunity and the balance between its various opportunities. Moreover, in the second slide below, investors can discern NVIDIA's capital allocation framework, reinforcing the idea of NVIDIA being a shareholder-centric company. Both of these slides provide color to NVIDIA's narrative.
We've extracted slides from the PDFs of 11,000+ public companies, making each mention on every slide in our database—spanning millions of slides—individually searchable. We've also tagged each slide based on its content, allowing users to search for terms like “Financial Target” and access all slides on this topic across the public markets in seconds. These tags are utilized for Key Slides and are carefully handpicked to ensure the best user experience possible. Here are the tags upon which we've built the Key Slides feature:
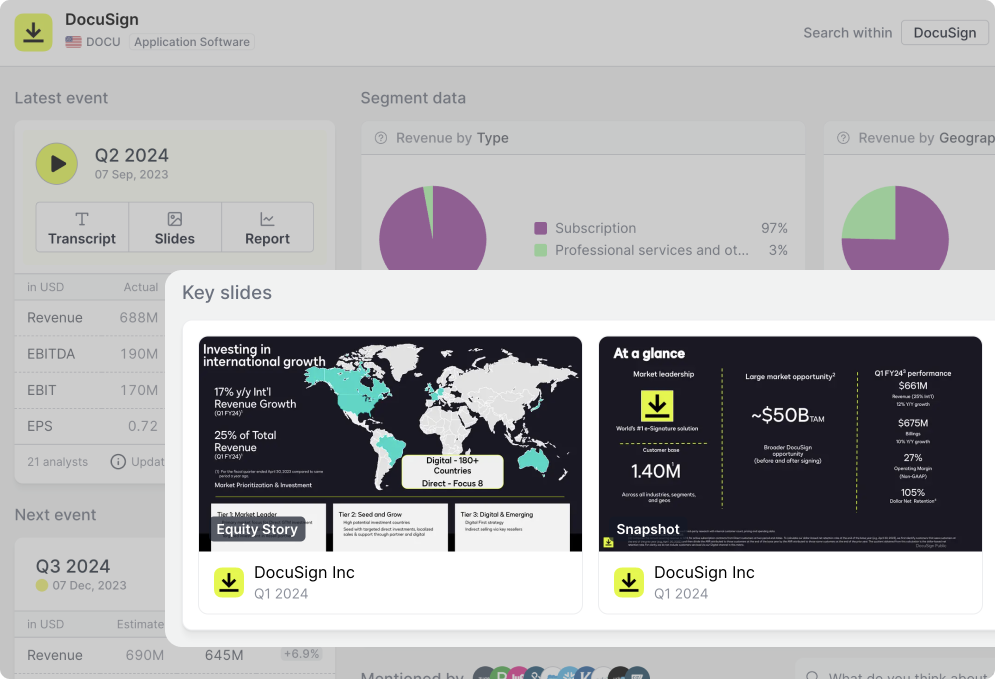
Equity story: An equity story or investment case slide is primarily directed towards investors, offering a view—typically stable over time—on why the company is a sound investment. Such slides typically encompass both qualitative and quantitative aspects of the business, summarizing them in 3-10 key points.
Snapshot: Many public companies present their most vital business elements in a single slide, offering a snapshot of the business. This category is akin to 'Equity Story', but the main distinction lies in its focus. While this tag often emphasizes the current state of the business, the equity story tends to remain stable over time. Furthermore, the snapshot slide, which often describes objective facts like a company's size, achievements, and summary financials, is less subjective than an equity story.
Business model: Slides generally offering an overview, explaining the revenue source and core activities that define the company's competitive edge. It might detail revenue streams, customer segments, value propositions, channels, relationships, key resources, and partners. Slides that use well-known business lingo to answer the 'how do you make money?' question, such as 'Freemium,' 'Franchise,' 'Subscription,' or 'one-stop-shop,' are commonly tagged with these terms.
Financial targets: Financial targets set for more than one year, or those maintained over time and against which results are benchmarked.
Outlook: Guidance and outlooks for both quarterly and yearly periods, as well as any instances where these projections are exceeded or raised.
Market overview: Slides outlining industry subsegments where companies operate, identifying total addressable markets, industry growth, and macro-level growth drivers such as spot prices or housing market trends.
Products and solutions: An overview of the entire portfolio or details of a specific product, solution, or brand, including its positioning and its price-to-value proposition. If the slide answers questions such as 'what is the customer specifically buying?' or 'from which brands are the customers buying?', then the slide is included in this category.
Market share: Slides showing a company's position in an industry using graphs, text, or tables. They highlight a company's relative size, even if mentioned as a supplier, competitor, or customer. These slides are rare, so we prioritize their significance.
Capital allocation: This tag covers companies' capital allocation strategies, including buybacks, dividends, debt repayment, M&A, and both maintenance and growth CAPEX. Even if slides mix pre-FCF topics like R&D with post-FCF decisions, they are categorized as capital allocation.
Unit economics: This category includes graphs, tables, or explanations about metrics such as the number of users, ACV (Average Contract Value), retention rates, churn, cohorts, user intensity, LTV/CAC (Lifetime Value to Customer Acquisition Cost) ratios, and marketing/sales efficiency.
Segment split: Slides whose primary purpose is to display the company's main exposures, often in terms of revenue, but possibly earnings, orders, GMV, or even an investment portfolio.
Management: This tag is solely about corporate culture and the backgrounds of managers and the board, including their tenure, experience, and ownership.
Mission and vision: Statements that articulate or illustrate why the company exists (its vision) and, to some extent, how it achieves its objectives (its mission).
Trading update: Commentary on how the next period has started, such as the first month of a quarter, is quite rare but highly valuable for financial analysts, investors, and journalists alike.
Footprint: Slides primarily illustrating the geographic regions where the company operates (e.g., in terms of revenue, headcount, stores, distribution, or other relevant criteria).
The Key Slides feature represents our commitment to delivering efficient, user-friendly, and actionable insights for our users. As the world of investing continues to evolve and become more complex, tools like these will be indispensable for those keen on making informed decisions without being buried under a mountain of data. Whether you're a seasoned analyst or a private investor, we ensure that understanding a company's narrative is just a few clicks away.
Get started with Key Slides
)
)