Edge16 Oct 2026
Winner, Winner: The Chicken McNugget Story
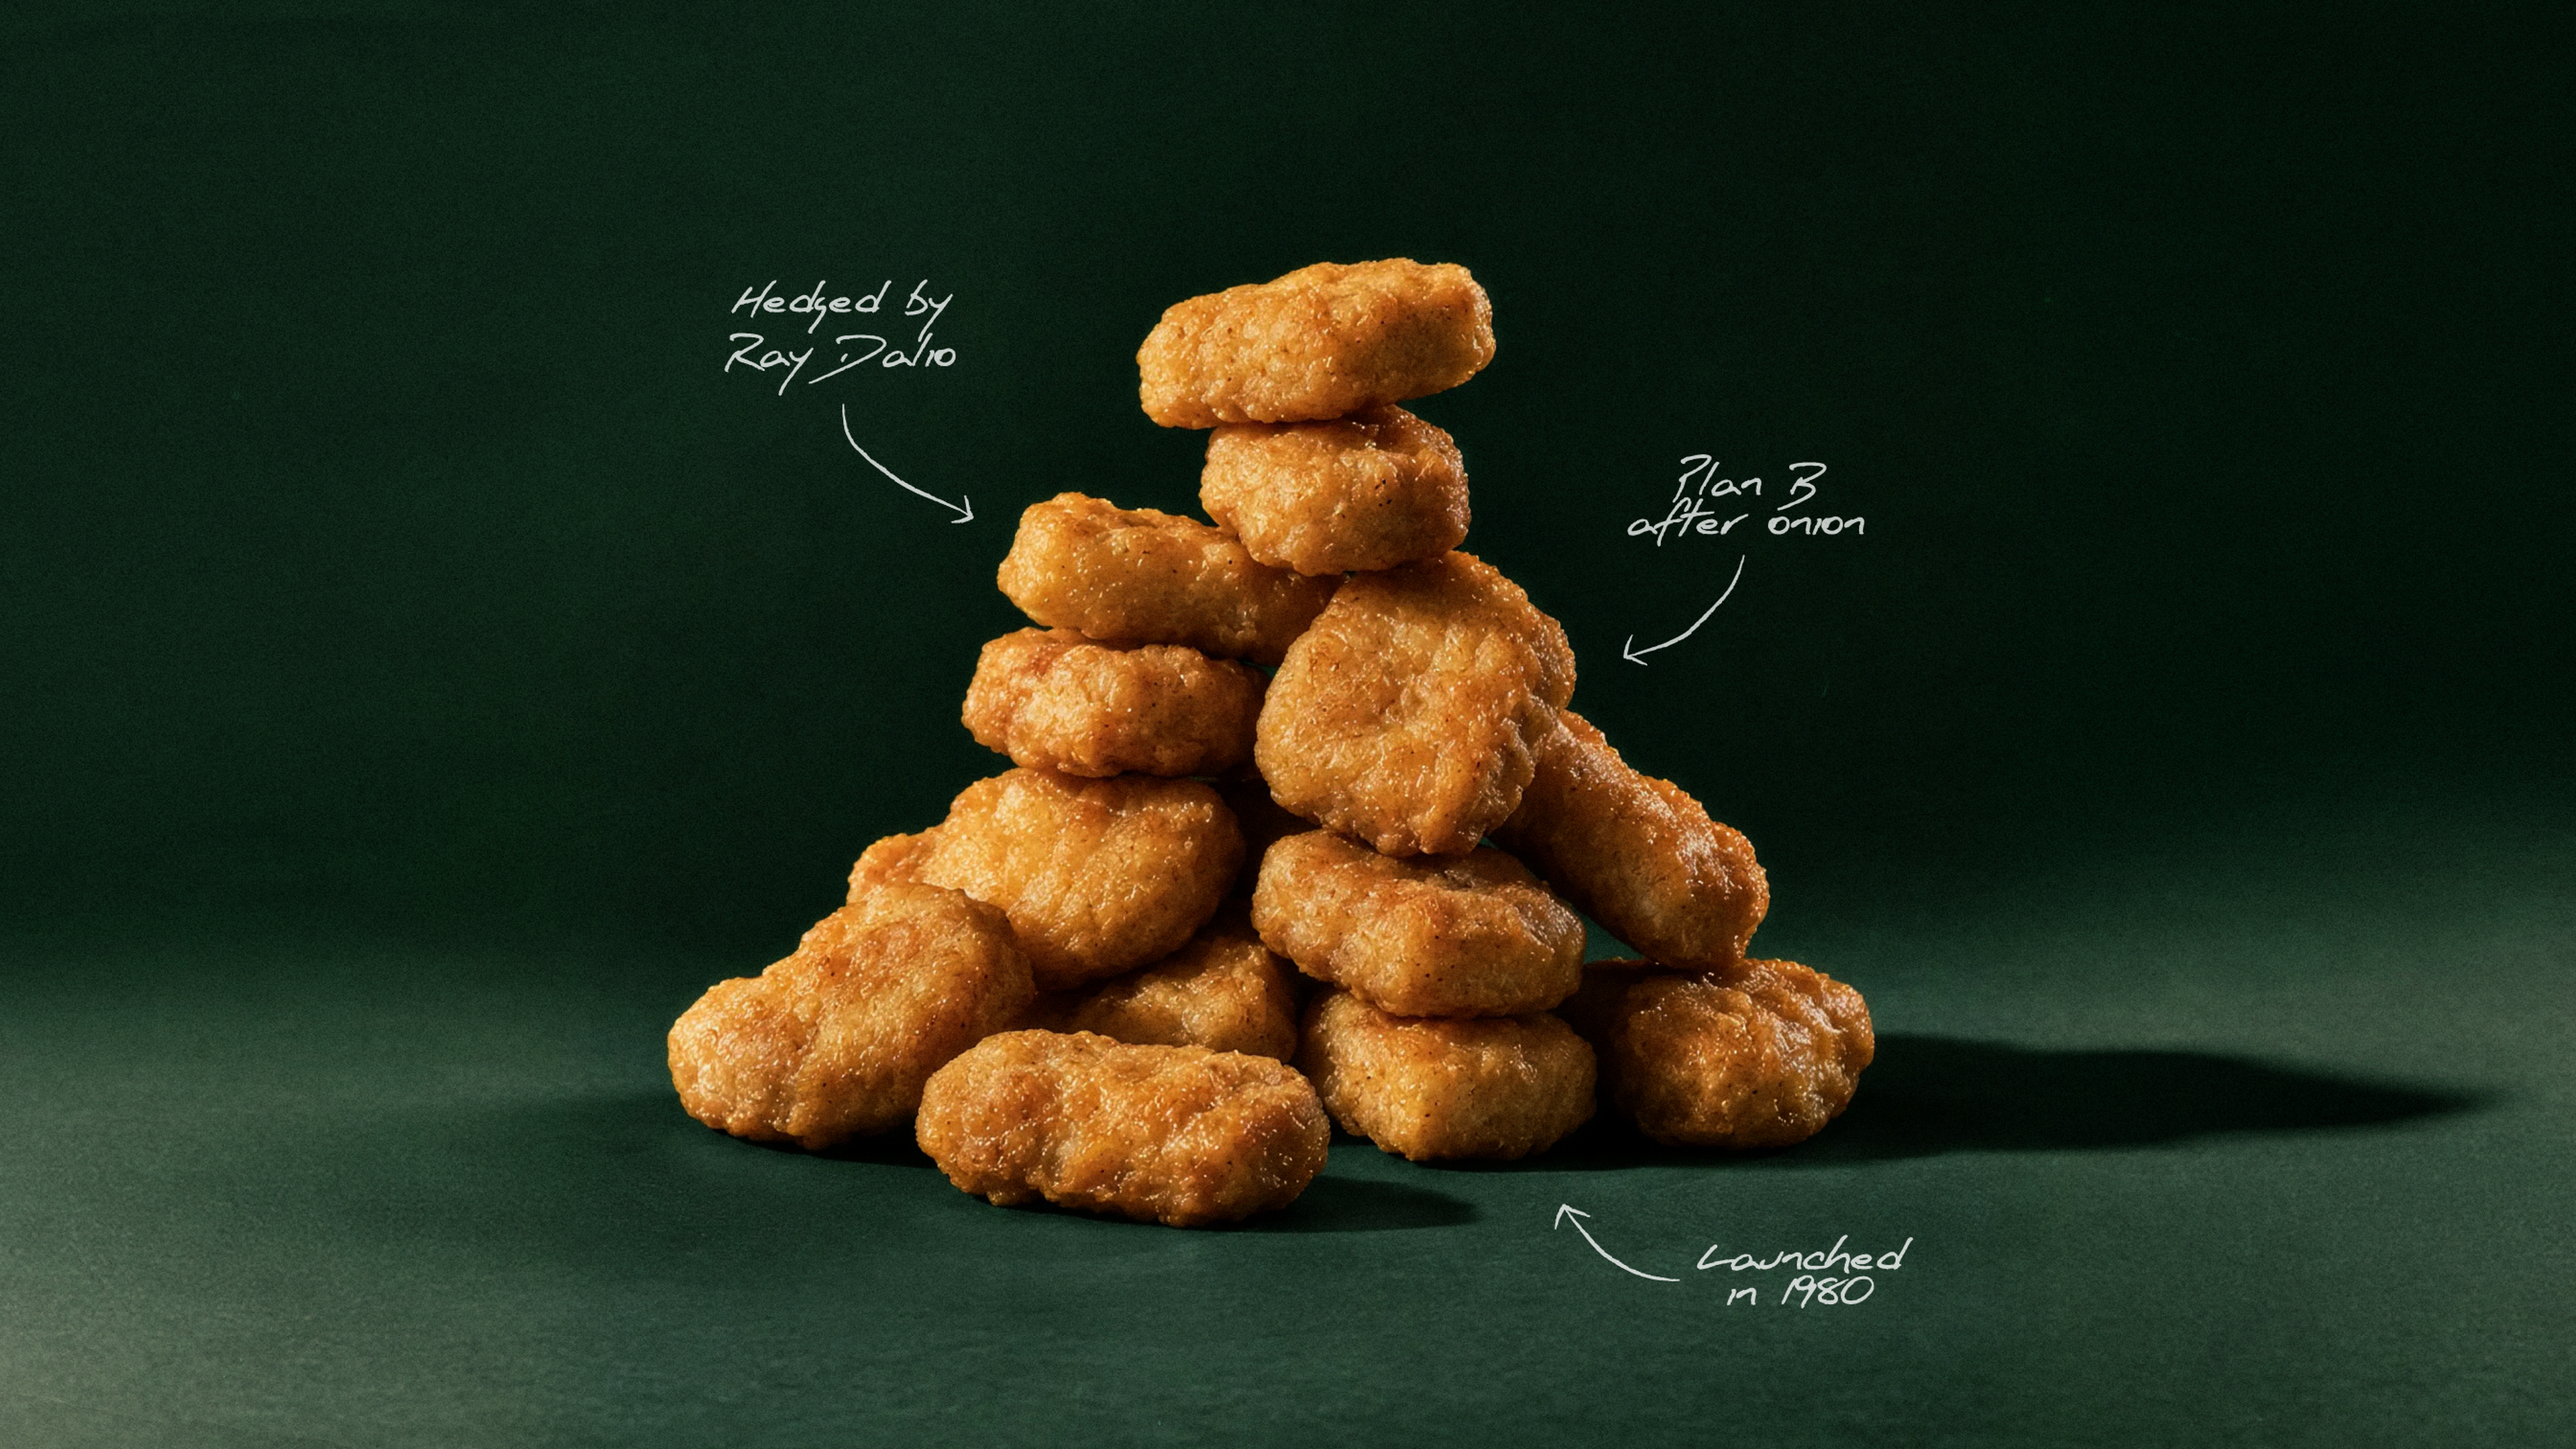
How a 1940s breeding contest, a Cornell food scientist, and a hedge by Ray Dalio helped McDonald's turn the Chicken McNugget into a fast-food icon.

Q3 net income was $233M; adjusted net operating income was $290M, or $7.62 per diluted share, while diluted EPS was $6.12.
Record quarterly net investment income of $634M supported results amid weaker underwriting and lower earned premiums.
Strategy prioritized underwriting margin, reserve conservatism and risk-adjusted returns over premium volume; casualty exposure was reduced while selected specialty and international opportunities remained growth areas.
Booked reserves exceeded actuarial central estimates by more than $850M at September 30, with most of the margin in reinsurance.
Core GWP was $3.663B, down 4.0% YoY on a comparable basis; total Q3 GWP was $3.742B, down 14.5% reported.
Q3 revenue was $3.713B versus $4.319B YoY; nine-month net income was $1.445B and adjusted net operating income was $1.620B.
Quarterly net investment income was a record $634M, including $144M from private equity; nine-month net investment income was $1.725B.
Net pre-tax catastrophe losses were $302M for Core businesses; net unfavorable prior-year development was $268M, adding 8.5 points to the combined ratio.
Nine-month operating cash flow was $1.606B versus $3.466B; cash ended at $987M, with cash and short-term investments totaling $4.0B.
January 1, 2027 reinsurance renewals are expected to be competitive, with further rate declines in CAT and peak zones; participation will remain selective against return thresholds.
Reinsurance casualty conditions remain challenging; casualty portfolio growth is not planned until conditions improve materially.
Global Wholesale & Specialty expects near-term combined ratios in the mid-to-high 90s while pursuing profitable specialty and international growth.
Share repurchases have a quarterly floor of $300M, with additional purchases depending on balance-sheet strength and earnings generation.
Legacy premiums are expected to decline as business earns off and commercial retail renewals transition; near-term operating cash flow could decline or turn negative as claims are paid.

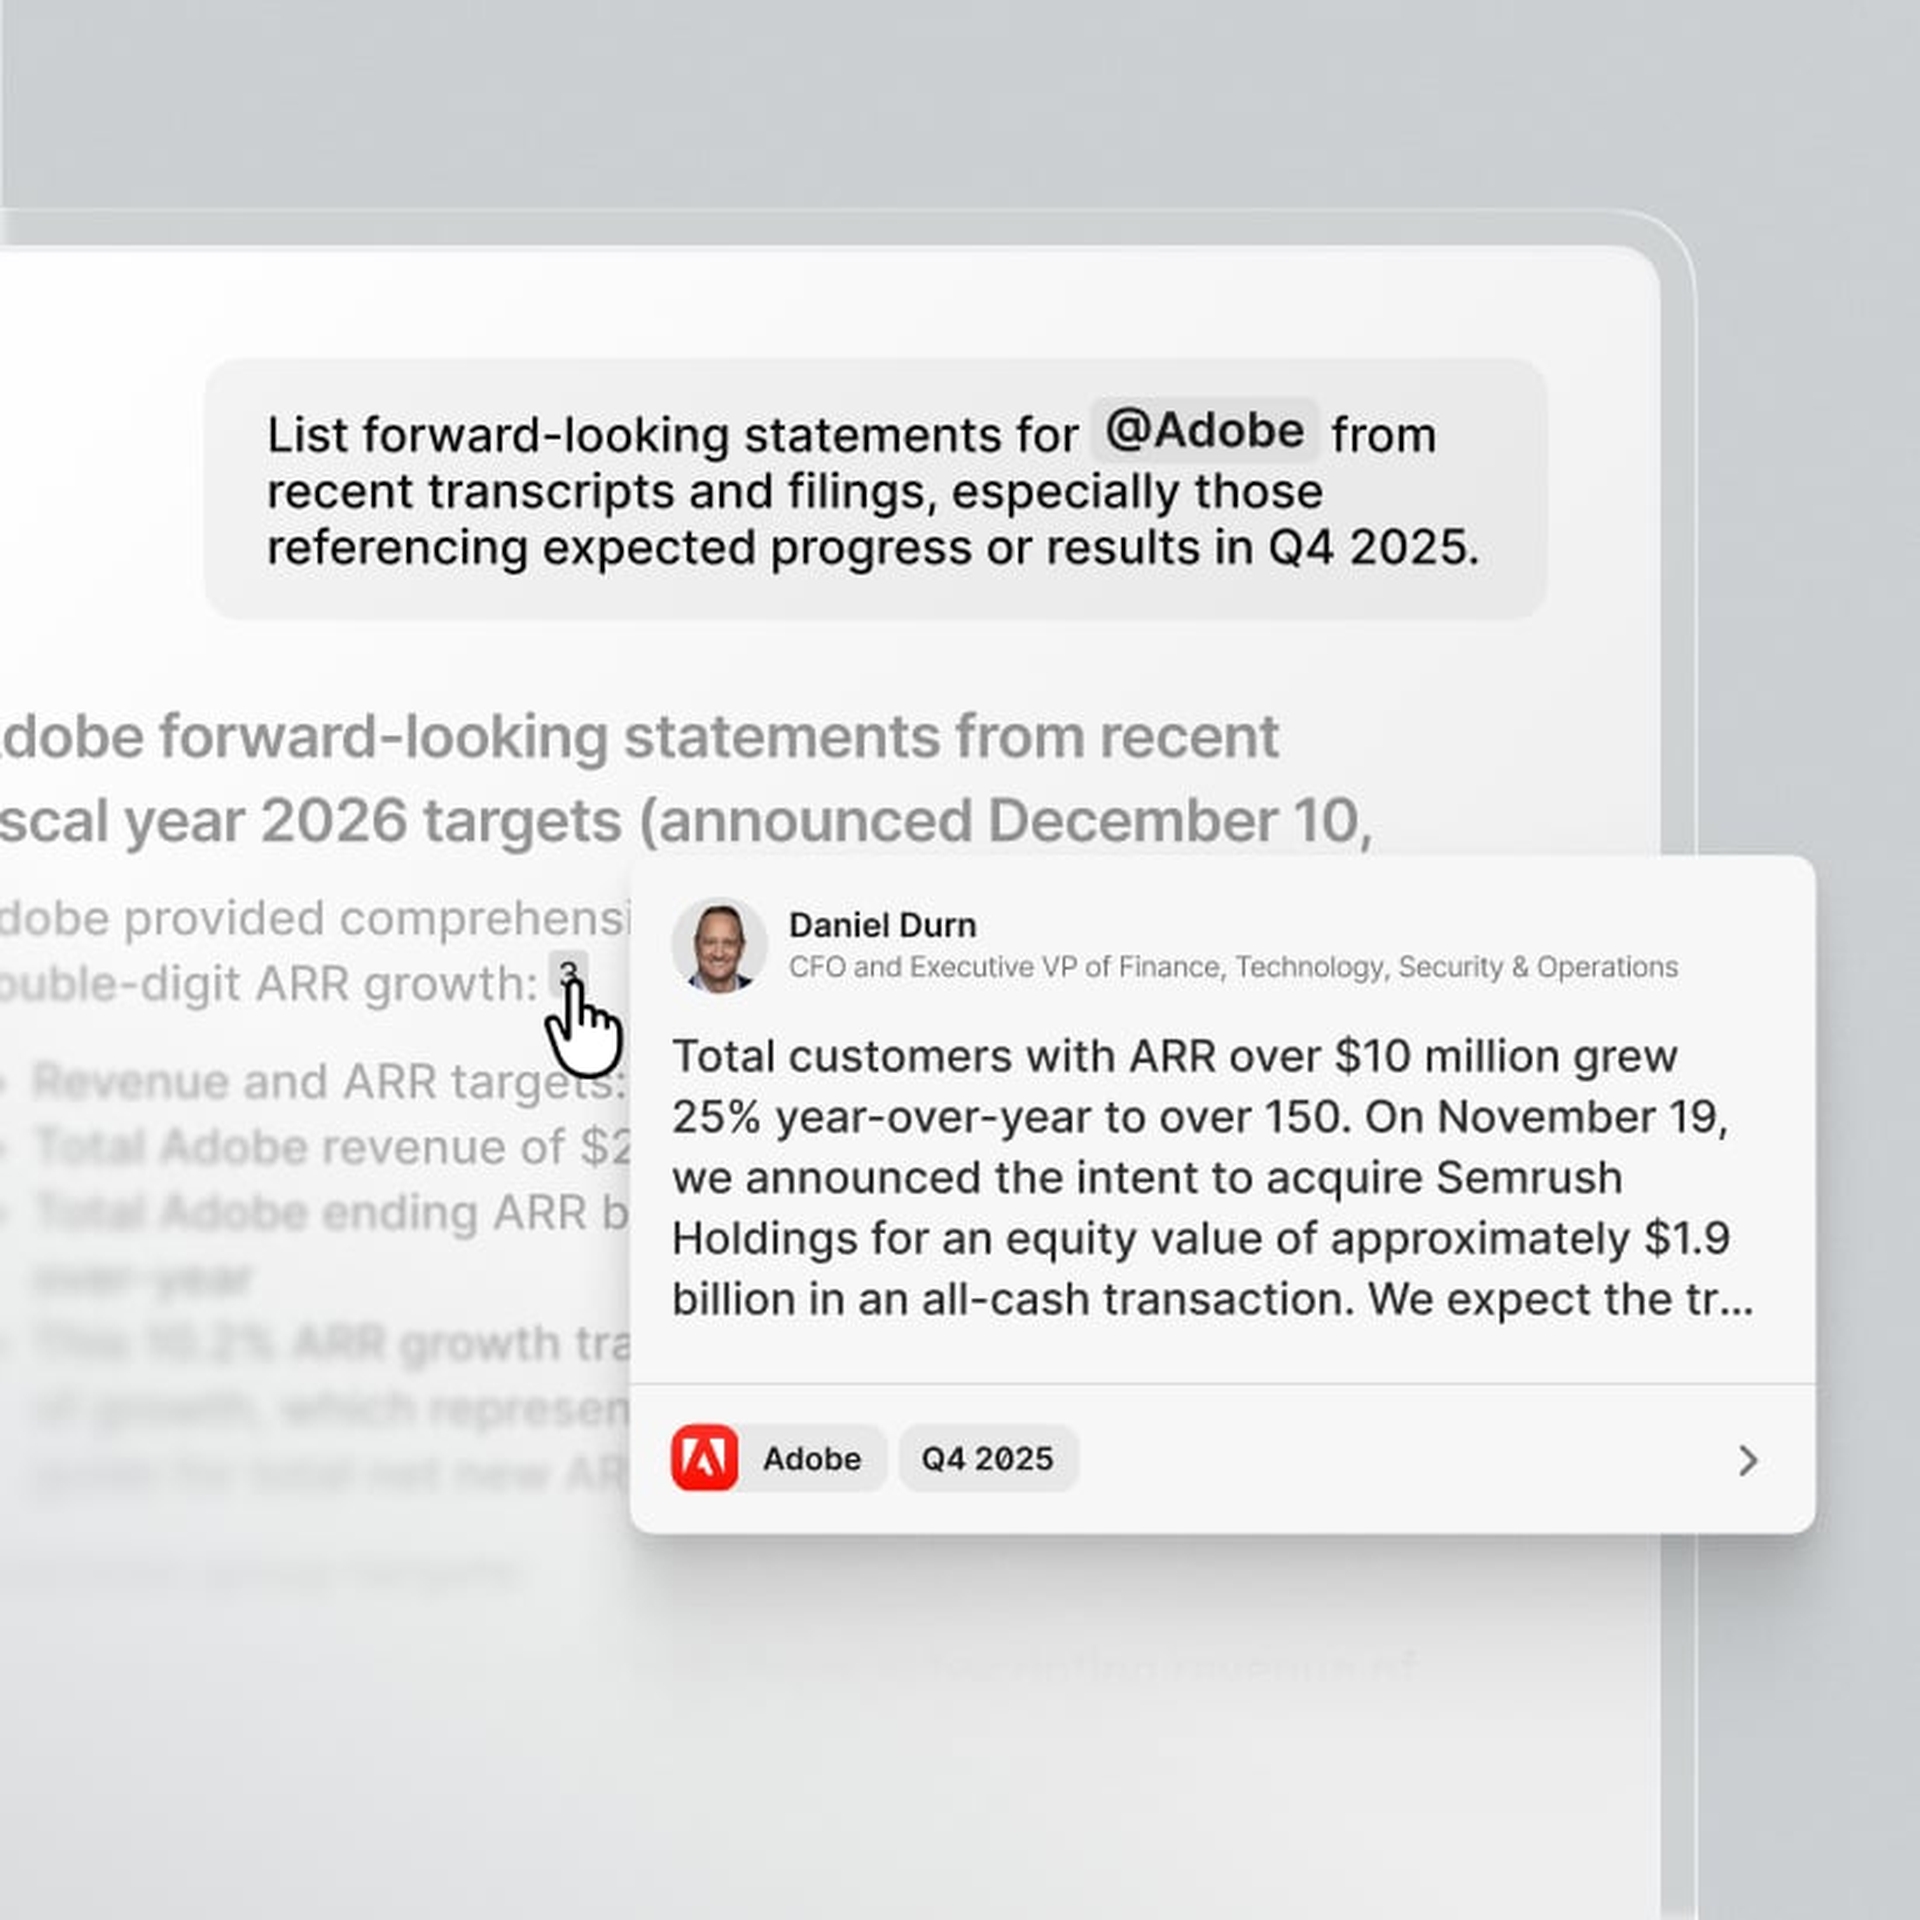
AI chat
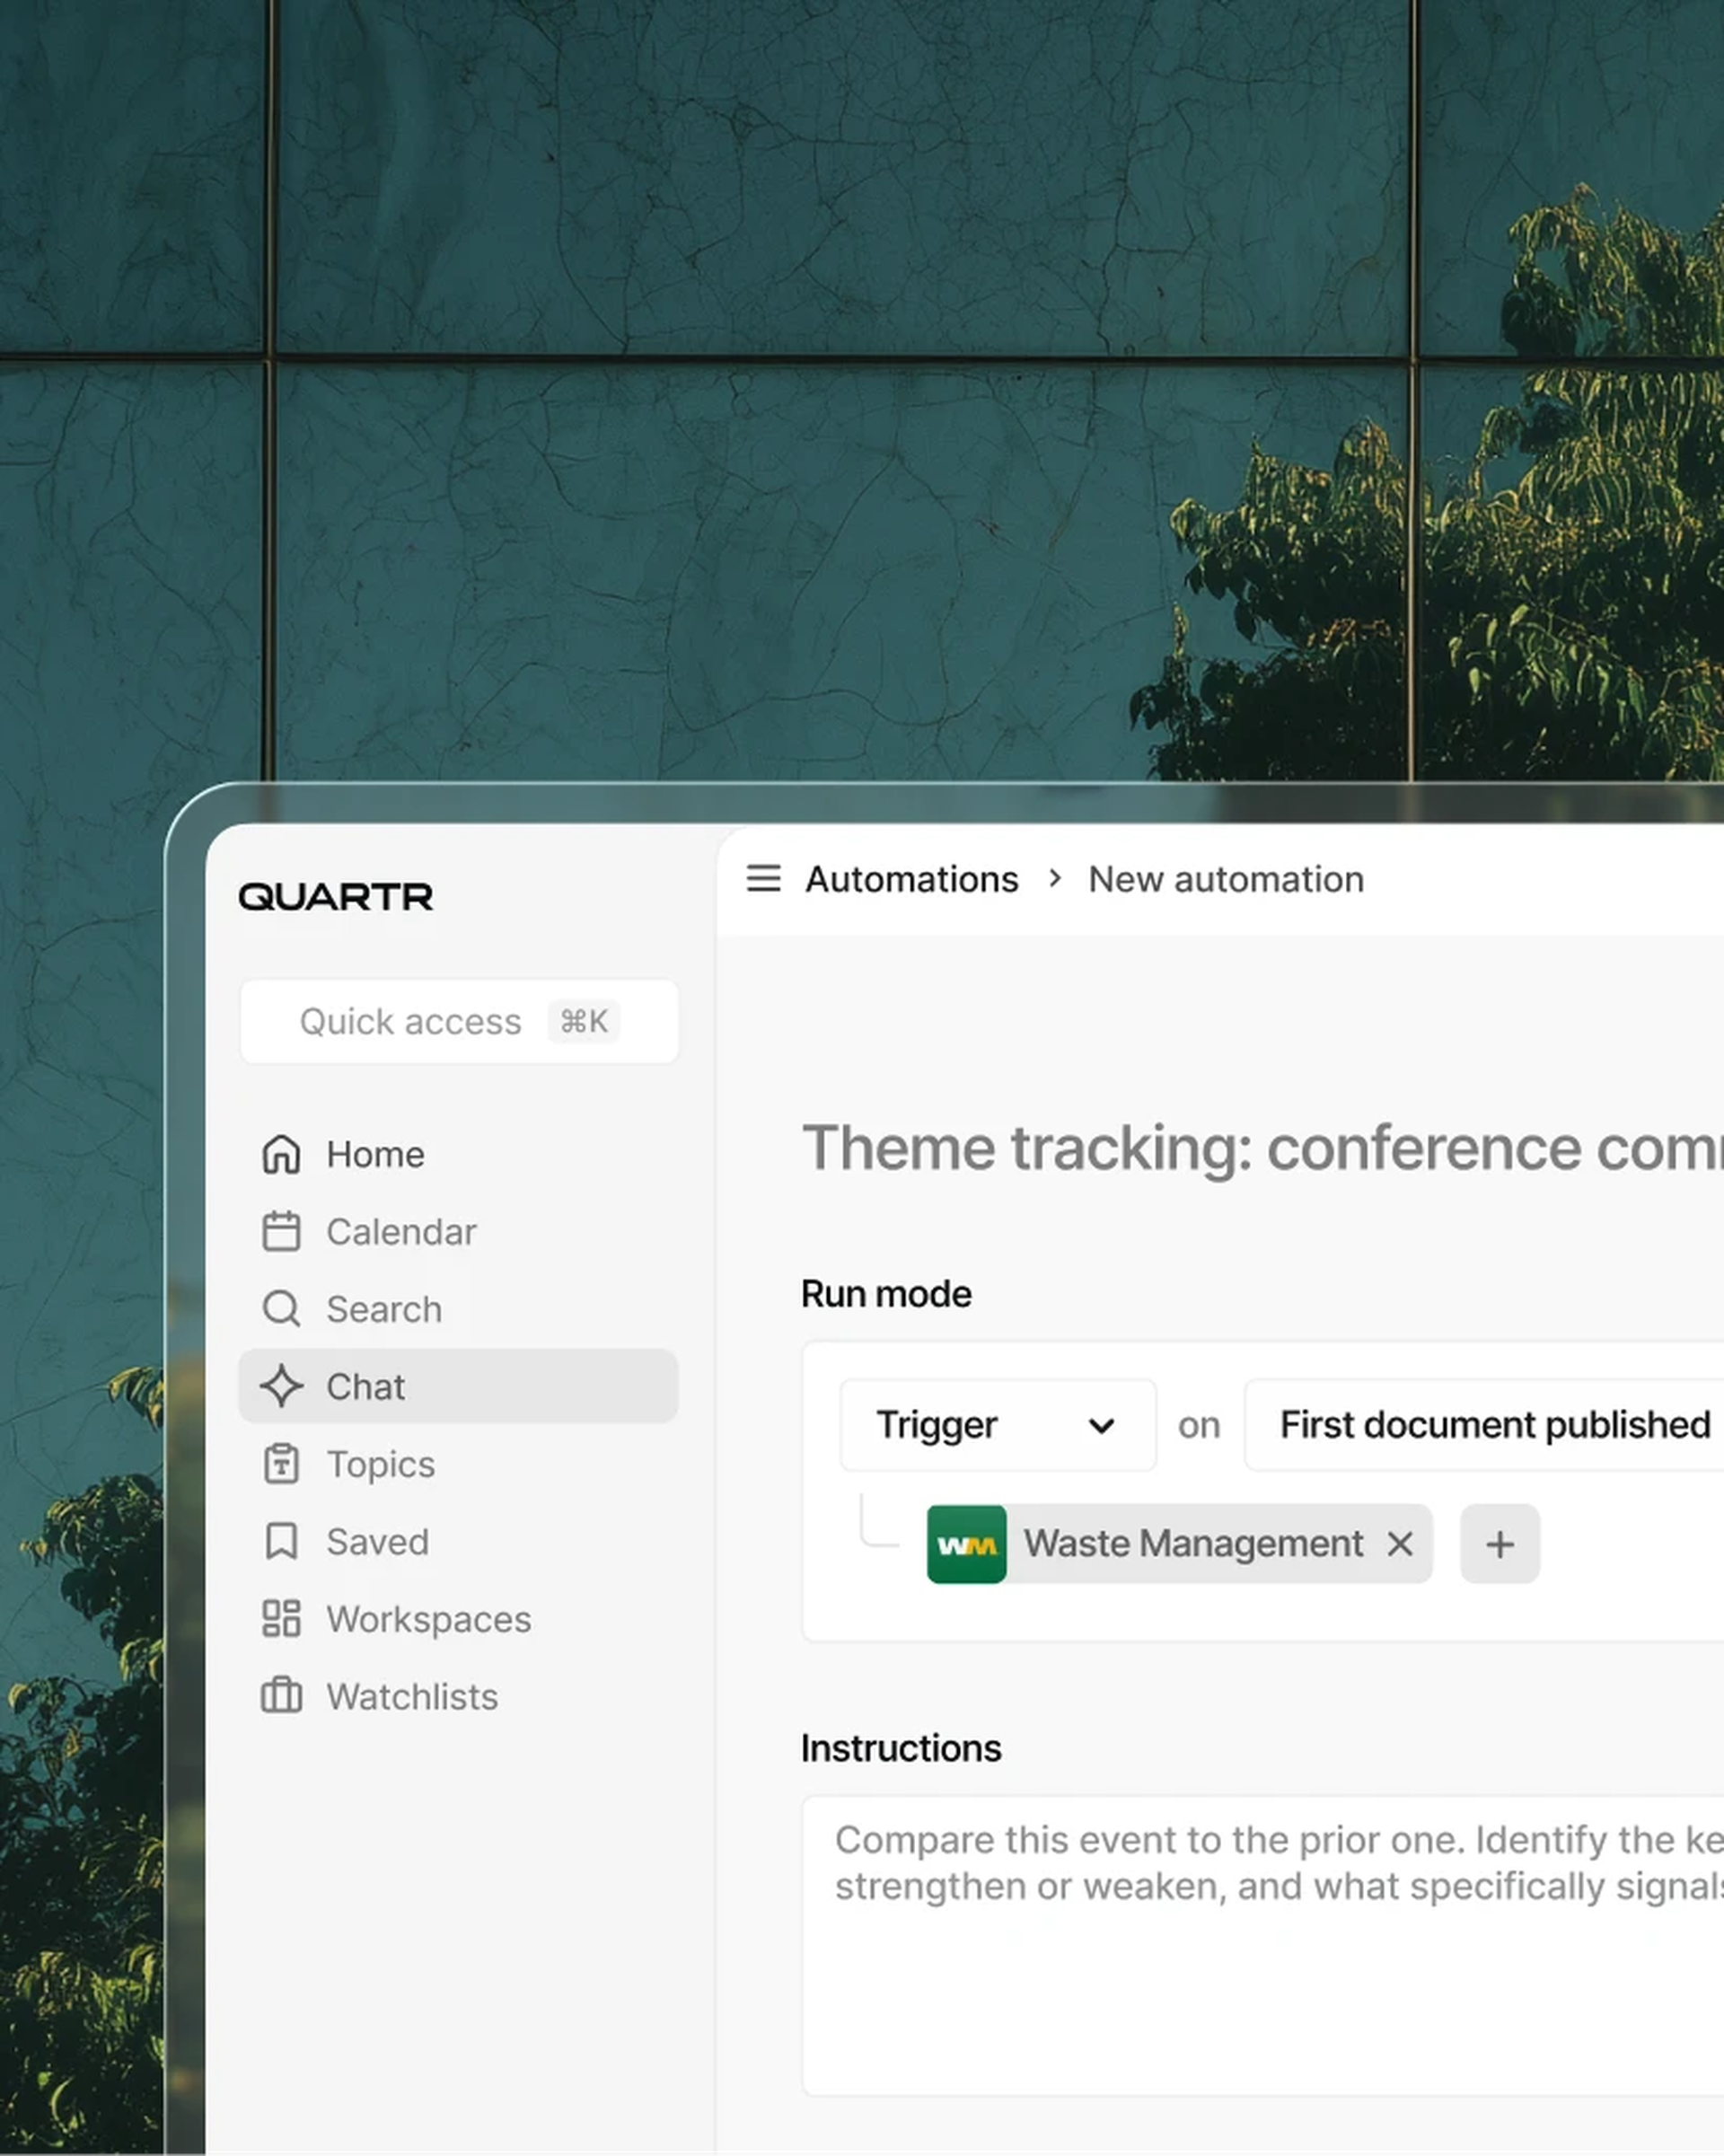
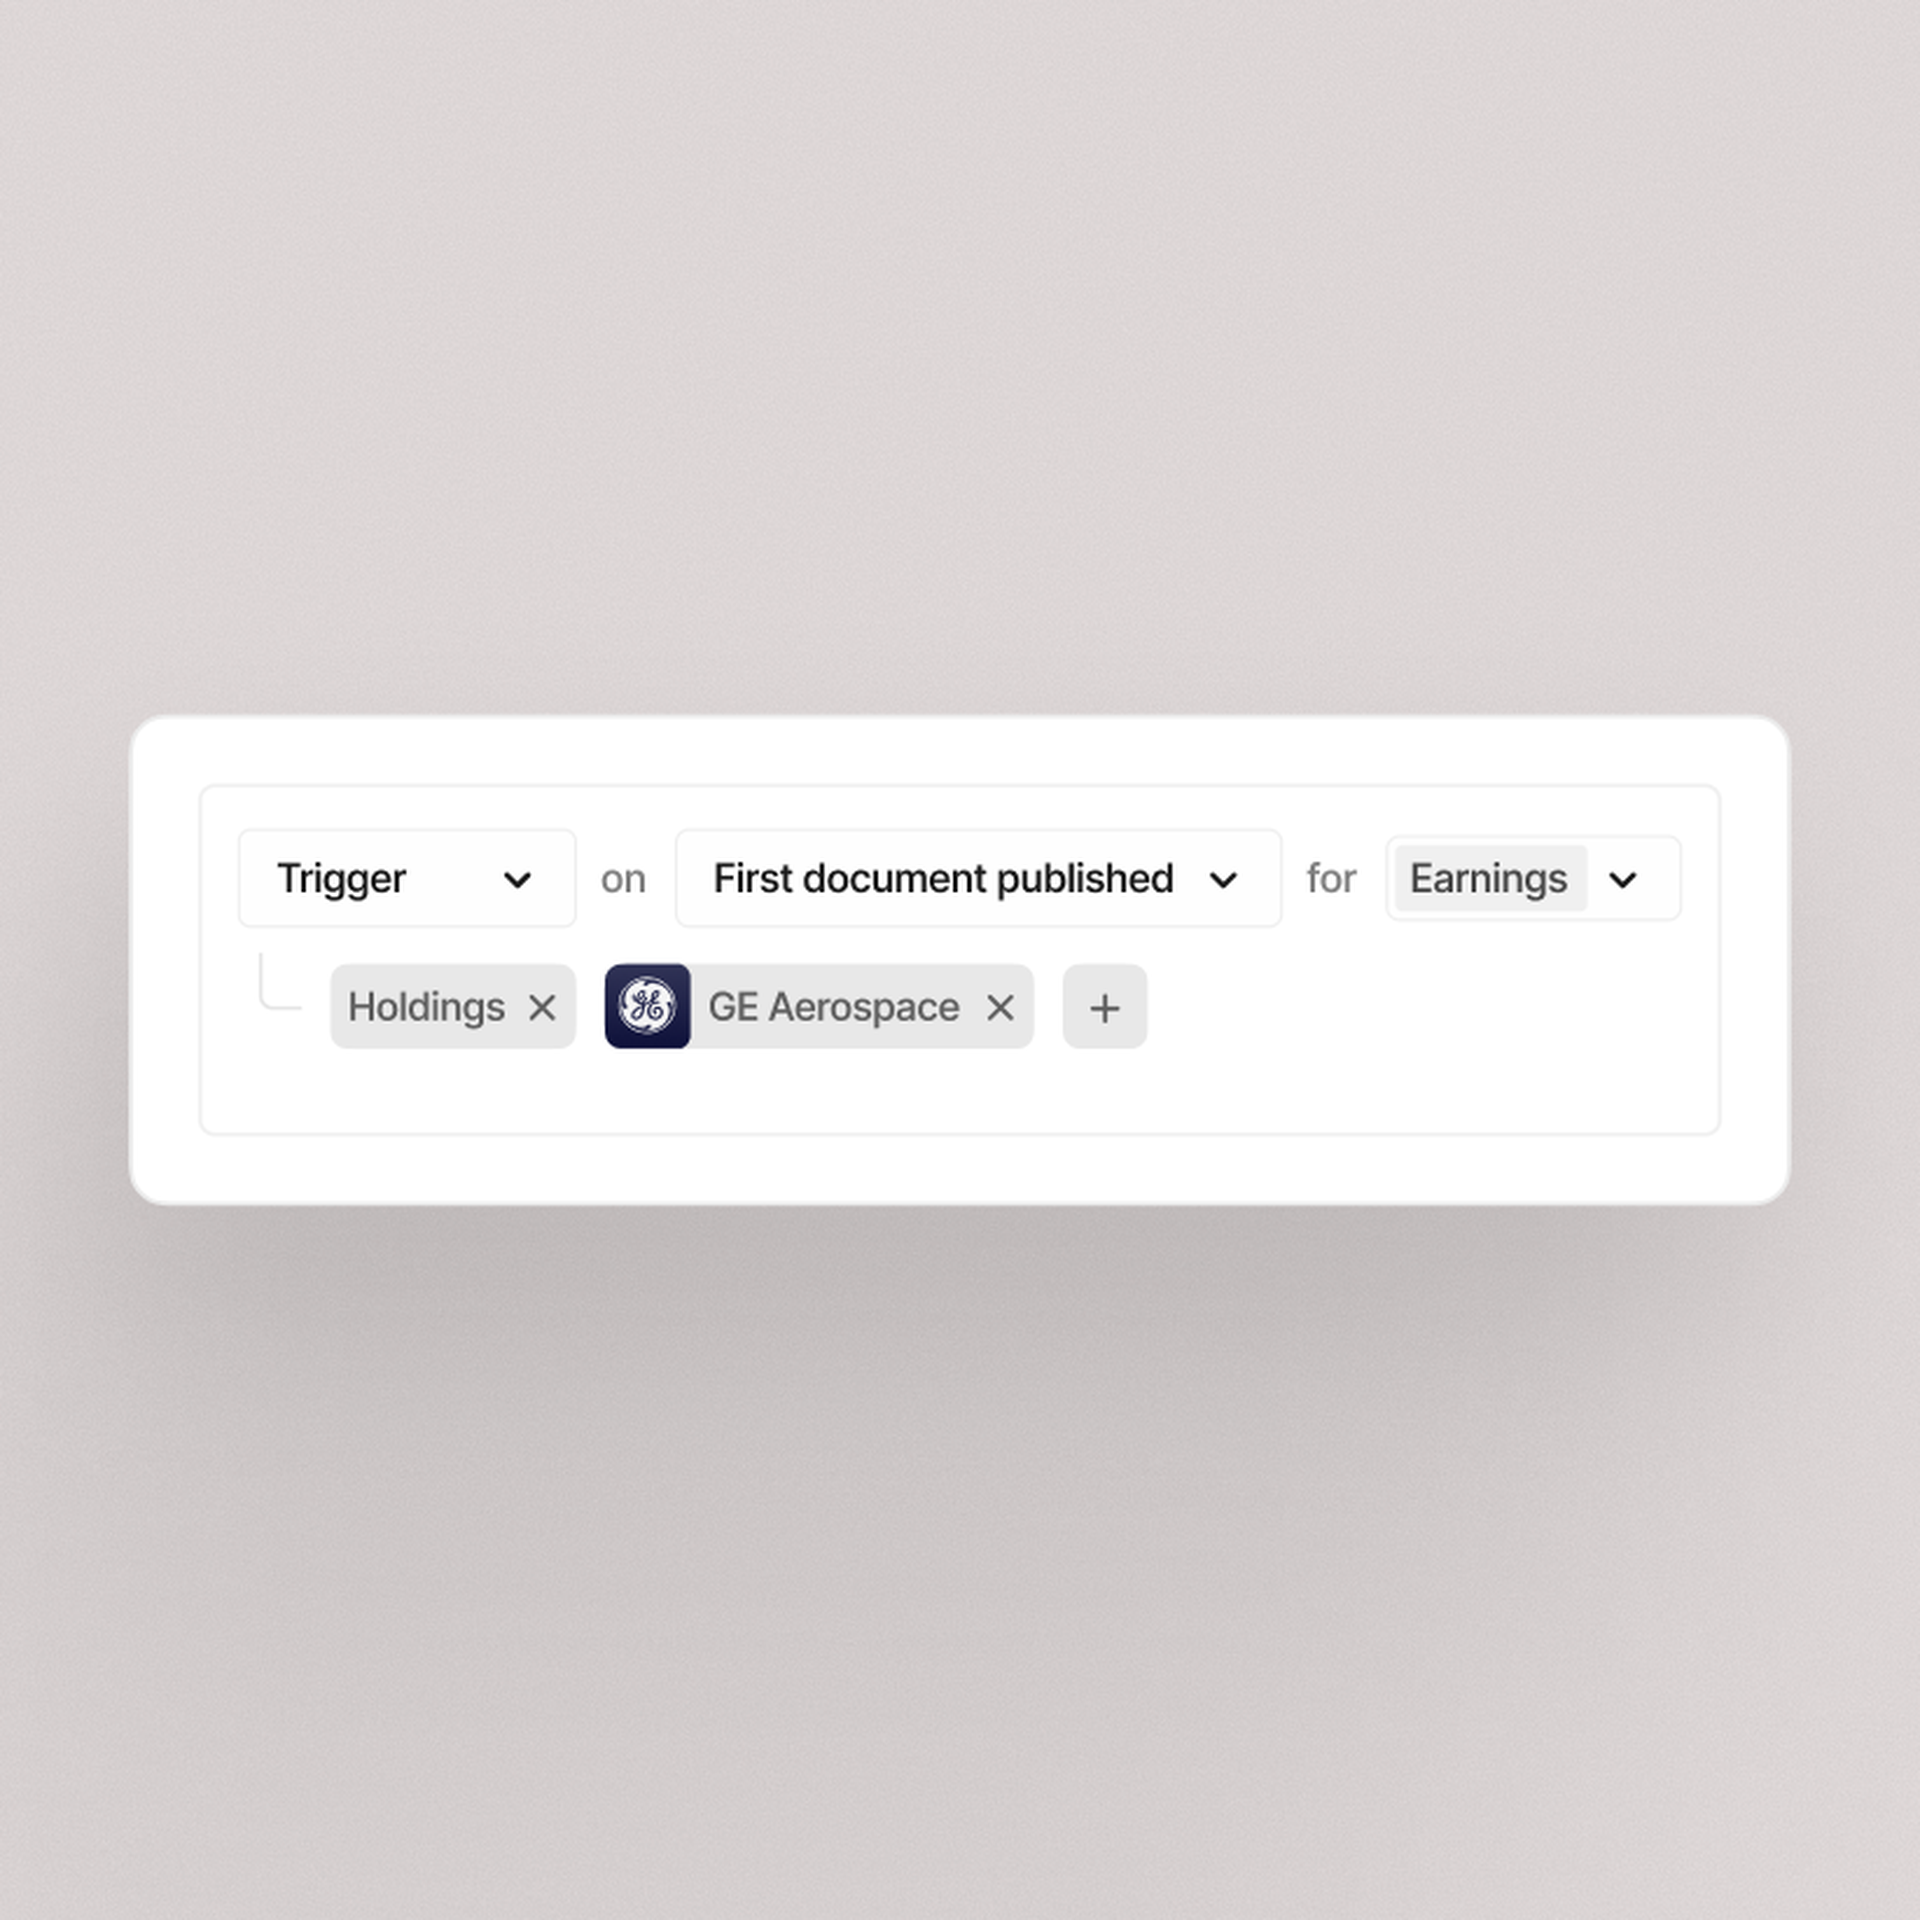
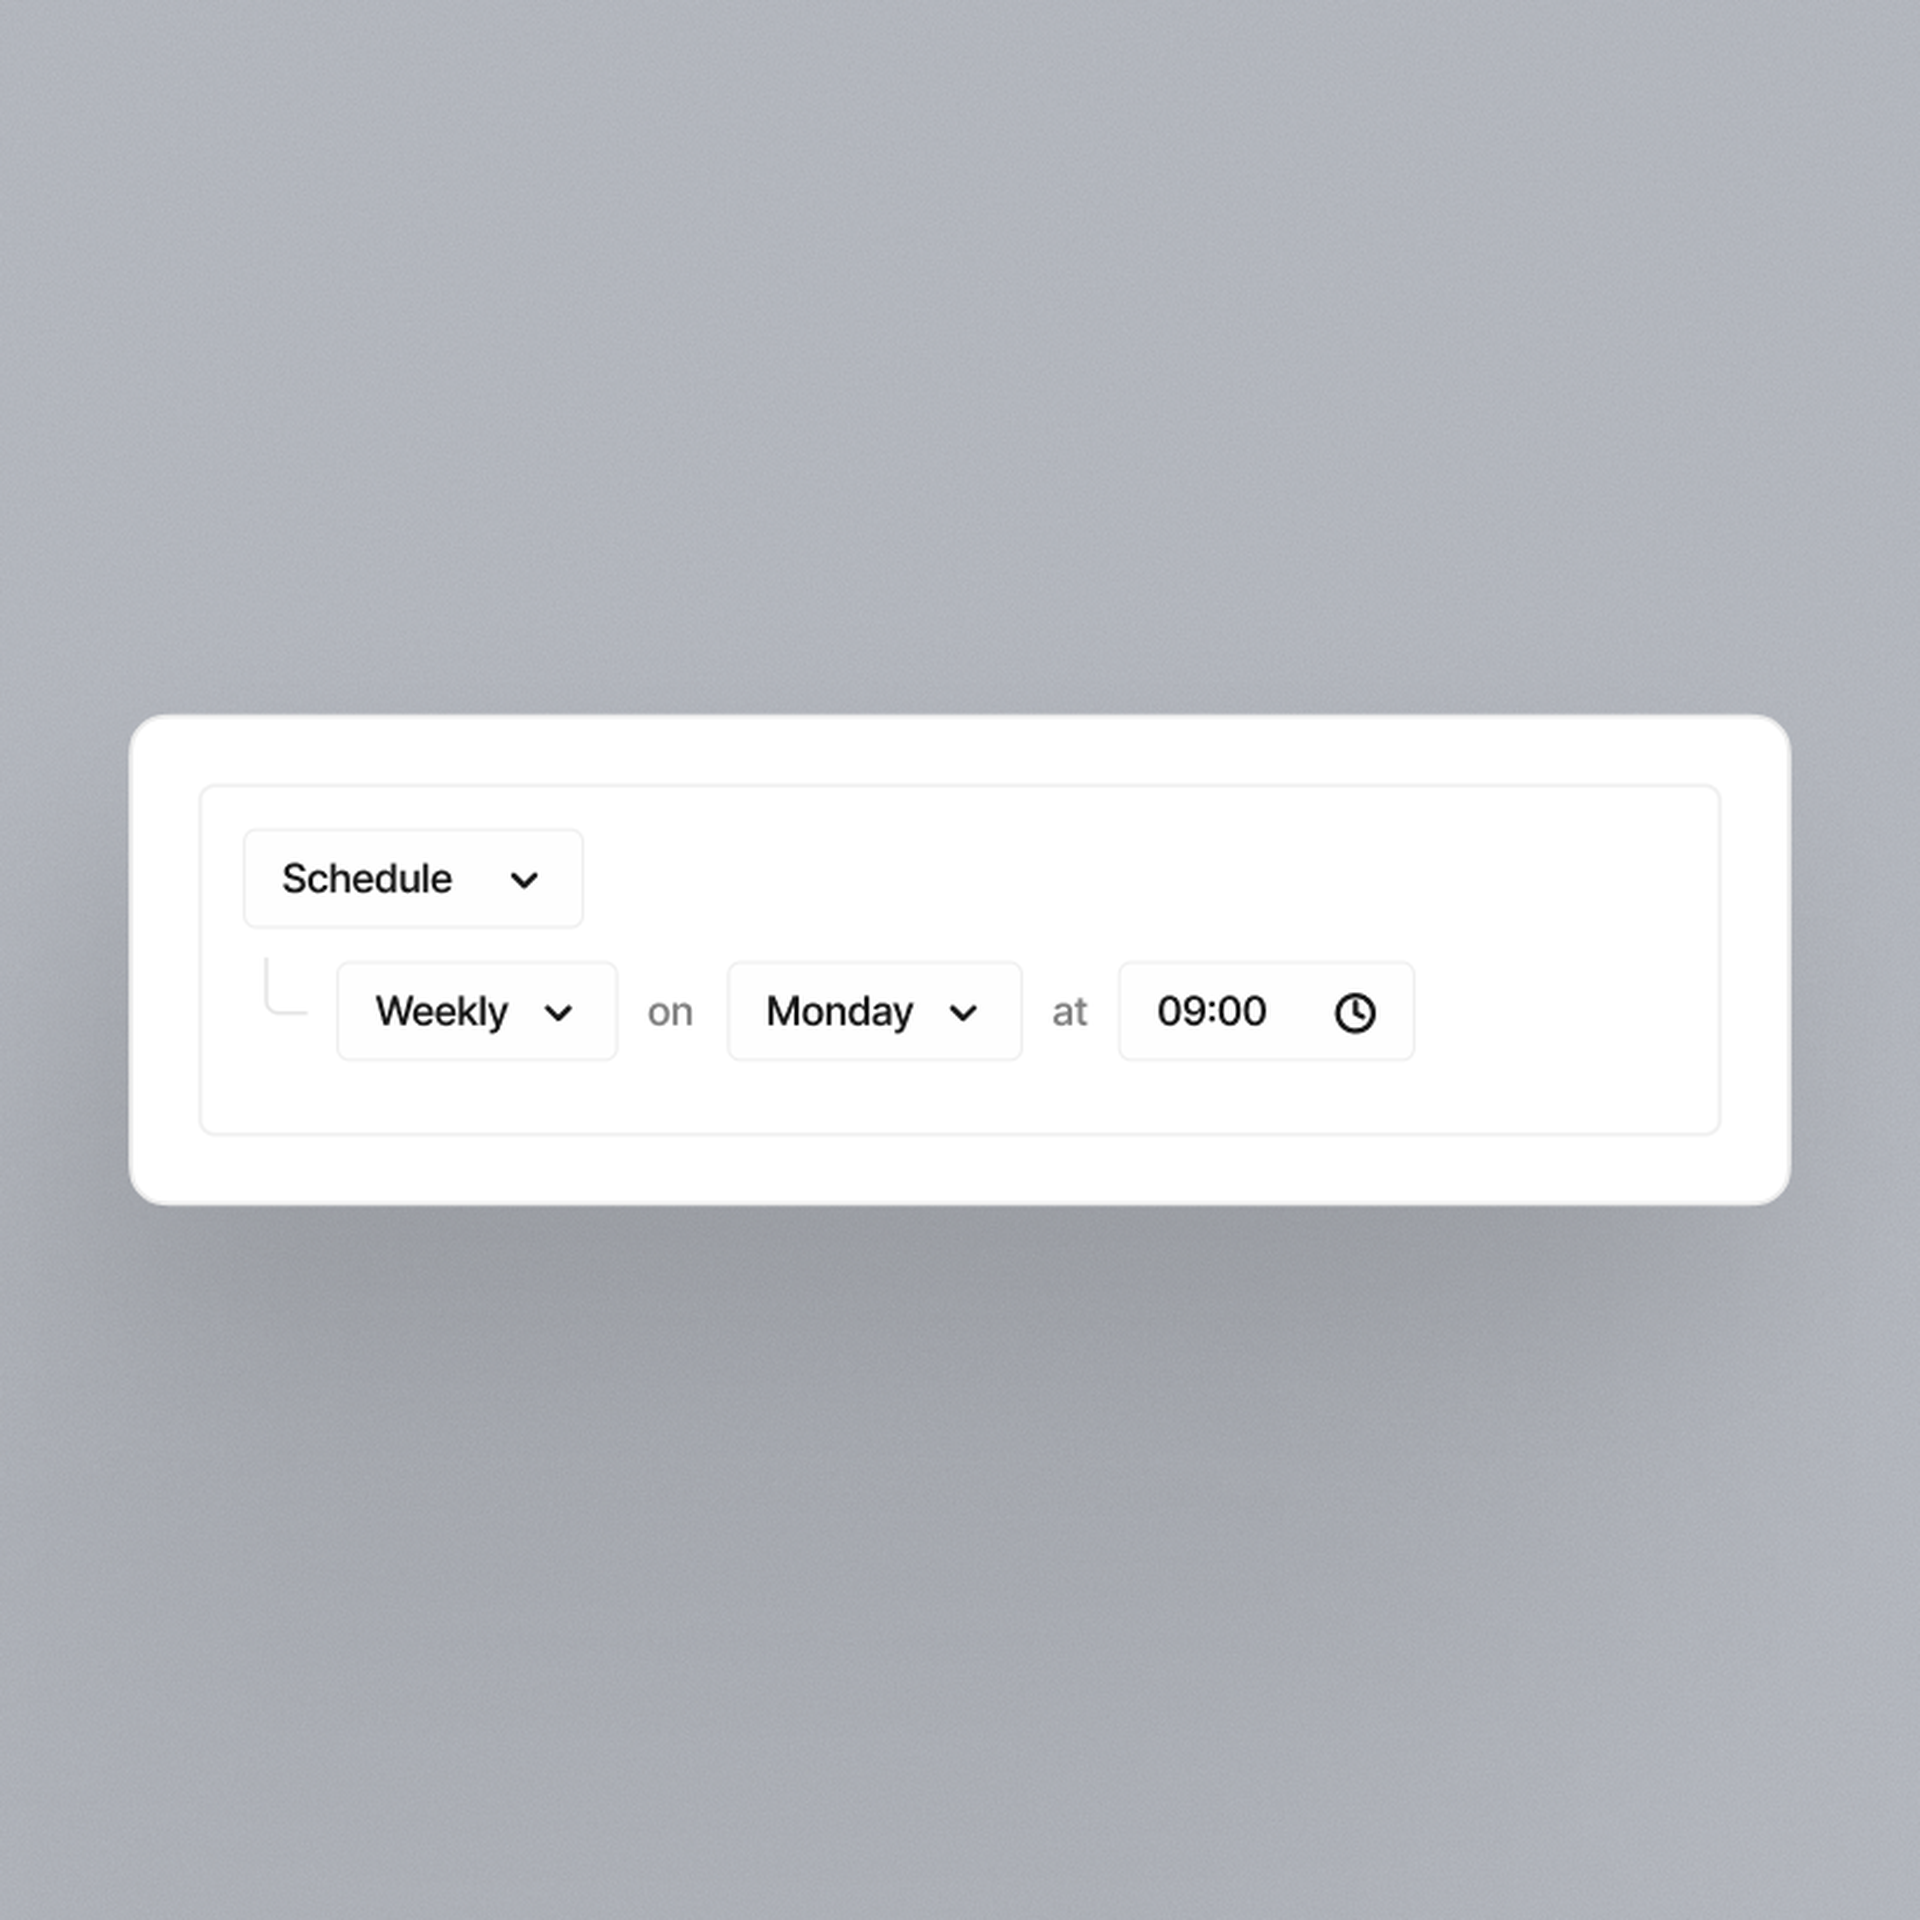
Automations
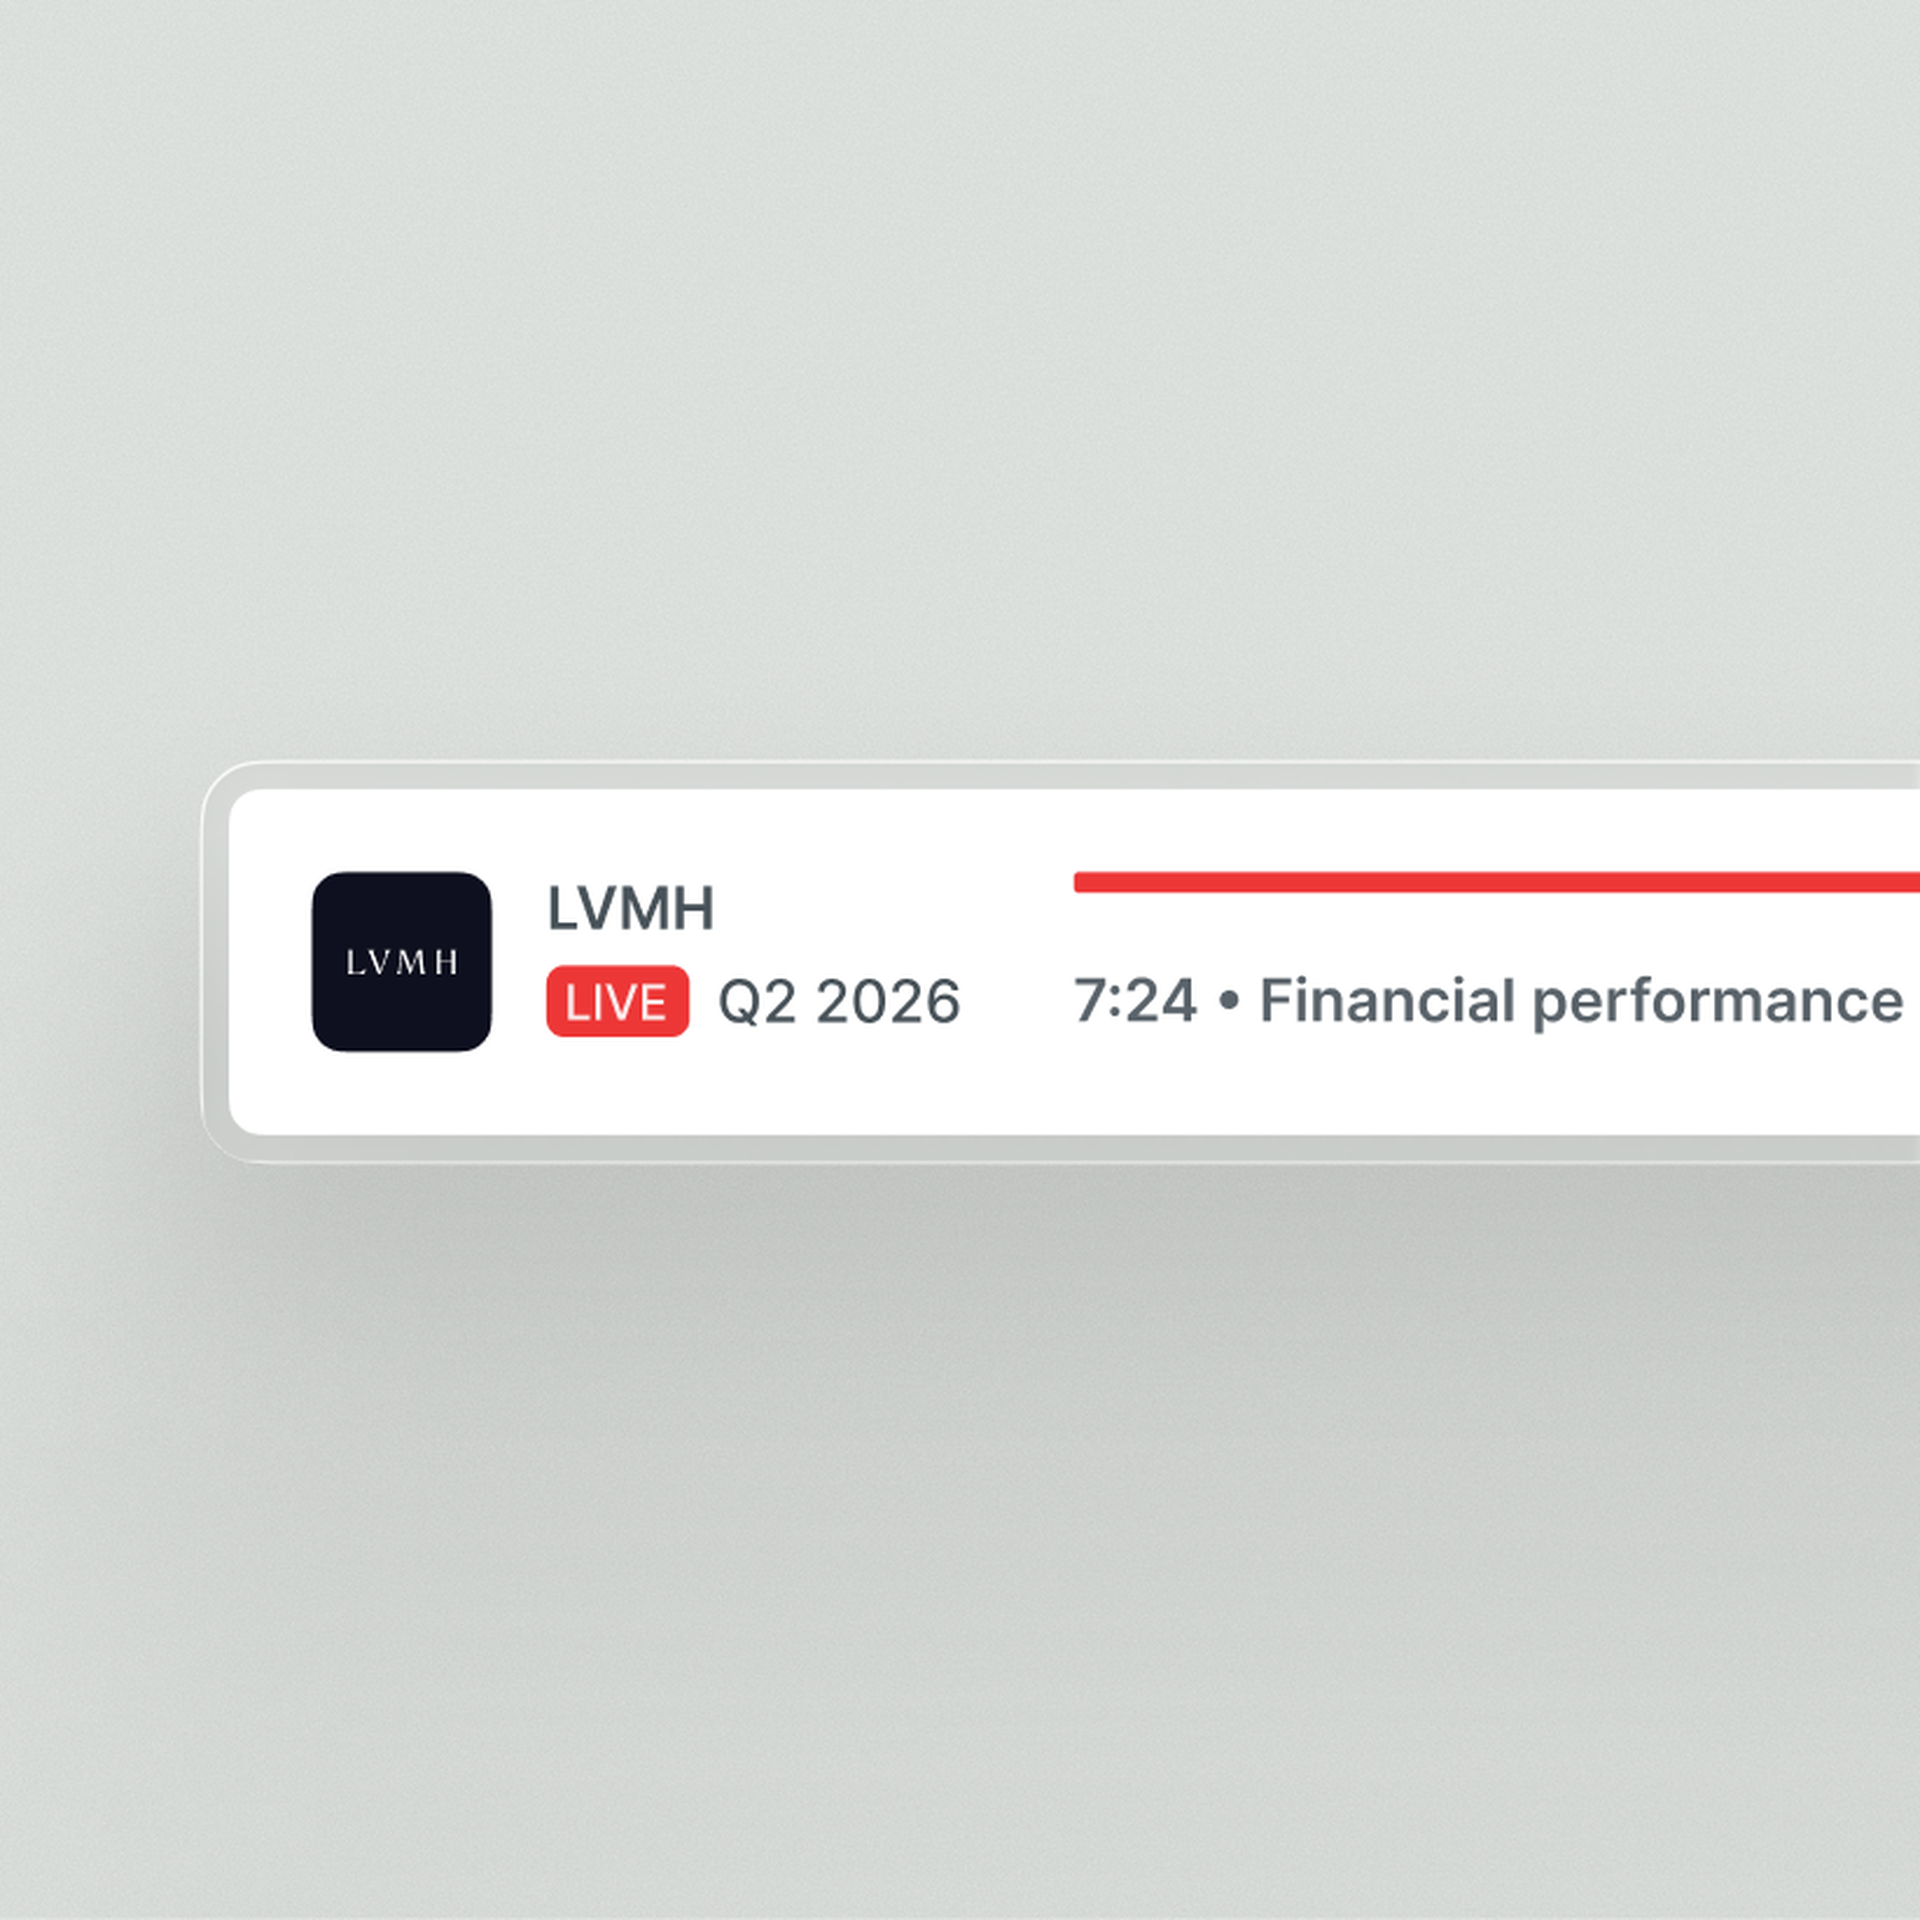
Live audio & transcripts
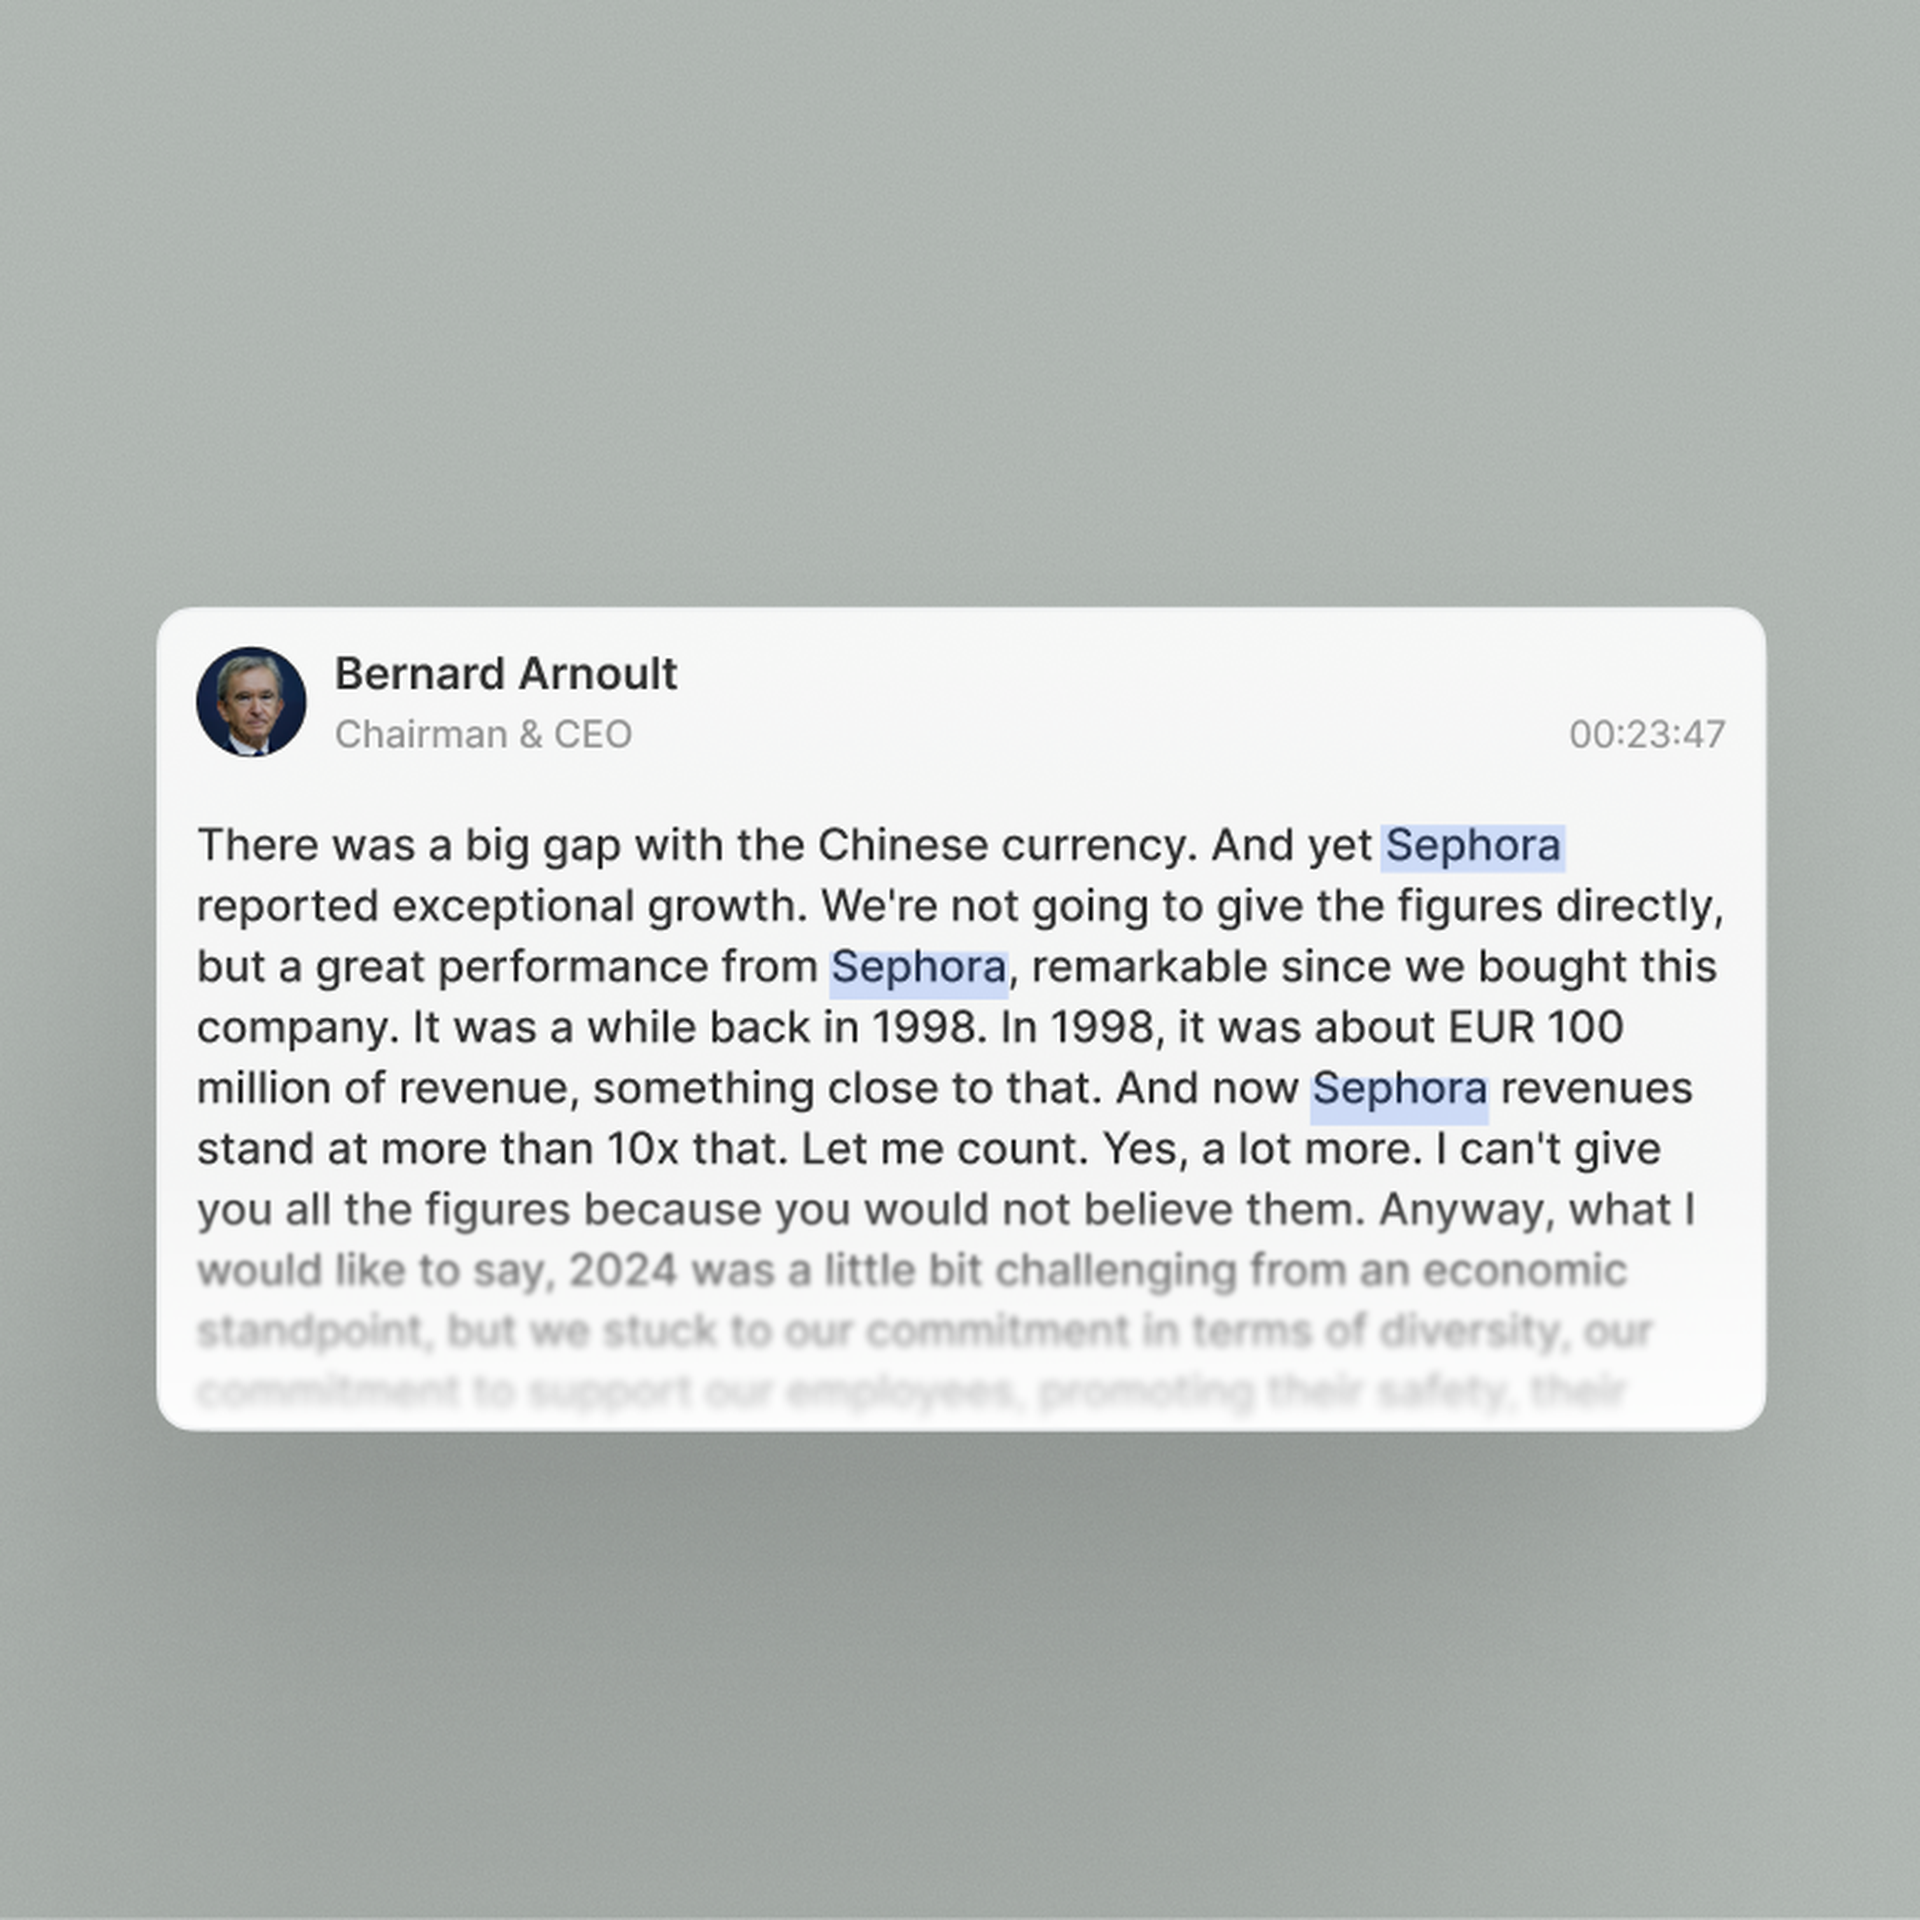
Quartr's AI stands out because it only pulls clean, first-party data from public companies. In investing, that's everything.
Jamie Ross
Investment Manager, GAM Investments
Research that used to take hours now takes seconds with Quartr Pro. Tracking shifts in tone or extracting tables, it's as simple as typing a query.
Tom O'Hara
Investment Director
Before Quartr we spent hours manually compiling insights through the peer earnings cycle. Now, these tasks are done faster, with greater precision.
Gregg Lampf
VP of Investor Relations
Being able to ask specific questions across years of transcripts and reports and instantly get verified answers is a game-changer.
Pontus Dackmo
CEO & Investment Manager